IQIRVO Film-coated tablet Ref.[110395] Active ingredients: Elafibranor
Source: FDA, National Drug Code (US) Revision Year: 2024
12.1. Mechanism of Action
Elafibranor and its main active metabolite GFT1007 are peroxisome proliferator-activated receptor (PPAR) agonists, both of which activate PPAR-alpha, PPAR-gamma, and PPAR-delta in vitro. However, the mechanism by which elafibranor exerts its therapeutic effects in patients with PBC is not well understood. Pharmacological activity that is potentially relevant to therapeutic effects includes inhibition of bile acid synthesis through activation of PPAR-alpha and PPAR-delta. The signaling pathway for PPAR-delta was reported to include Fibroblast Growth Factor 21 (FGF21)-dependent downregulation of CYP7A1, the key enzyme for the synthesis of bile acids from cholesterol.
An in vitro PPAR functional assay showed that both elafibranor and GFT1007 produced activation of PPARalpha (EC50 = 46 nM and 14 nM, respectively, and Emax = 56% and 61%, respectively, relative to reference agonists). The potency of elafibranor and GFT1007 for PPAR-alpha activation exceeded the respective potencies for PPAR-gamma and PPAR-delta activation by approximately 3- to 8-fold. Although the in vitro pharmacology studies detected PPAR-gamma activation by elafibranor and its metabolite GFT1007, toxicology studies in rats and monkeys (species with plasma metabolite profiles comparable to human) showed none of the adverse effects that are associated with PPAR-gamma activation.
12.2. Pharmacodynamics
In patients with PBC treated with 80 mg once daily of IQIRVO (Study 1), a greater reduction in mean alkaline phosphatase (ALP) from baseline was observed as early as 4 weeks after treatment compared to the placebo group and lower ALP was generally maintained through week 52 [see Clinical Studies (14)].
In another study, there was no apparent dose dependent increase in the reduction of ALP from baseline observed between 80 mg and 120 mg (1.5-times the recommended dose) once daily dosing in patients with PBC.
Cardiac Electrophysiology
At 3.75-times the recommended dose of 80 mg, IQIRVO did not cause clinically significant QTc interval prolongation.
12.3. Pharmacokinetics
Following once daily dosing, steady state of elafibranor was achieved by Day 14, while steady state of GFT1007 was achieved by Day 7. The pharmacokinetics (PK) of elafibranor and GFT1007 were timeindependent after 16-day repeated administration. At steady state, mean AUC0-24h of elafibranor and GFT1007 increased 3.3-fold and 2.6-fold for a 2.5-fold dose increase from 40 mg to 100 mg and 2.9-fold and 2.2-fold, respectively from 120 mg to 300 mg. Mean AUC0-24 of GFT1007 was 3.2-fold higher than the elafibranor exposure in patients with PBC at steady state.
Table 5. Elafibranor and GFT1007 Systemic Exposures at Steady State in Patients with PBC Following 80 mg Once Daily:
| Cmax,ss (ng/mL)a Mean (SD) | AUC0-24 (ng • h/mL)a Mean (SD) | AUC ratio between Day 15/Day 1 Mean (min, max)a | |
|---|---|---|---|
| Elafibranor | 802 (443) | 3758 (1749) | 2.9 (0.86- to 13) |
| GFT1007 | 2058 (459) | 11985 (7149) | 1.3 (0.6- to 3) |
Abbreviations: AUC = area under the concentration-versus-time curve; Cmax = maximum concentration; SS = Steady State a Day 15 following repeated elafibranor 80 mg once daily administration in patients with PBC
Absorption
Following once daily dosing of 80 mg in patients with PBC, median time to peak plasma concentrations (Tmax) of elafibranor and GFT1007 was 1.25 hours (range: 0.5-2 hours).
Effect of Food
When administered with a high-fat and high-calorie meal, Tmax was delayed by 30 minutes for elafibranor and by 1-hour for GFT1007 compared to in fasted conditions. Under fed condition, mean Cmax and AUC of elafibranor decreased by 50% and 15% respectively and mean Cmax of GFT1007 decreased by 30%, but the AUC was not affected compared to fasted conditions. The difference was not clinically meaningful.
Distribution
Plasma protein binding of both elafibranor and GFT1007 was approximately 99.7% (mainly to serum albumin). The mean apparent volume of distribution (Vd/F) of elafibranor in healthy subjects was 4731 L, following a single dose of elafibranor at 80 mg in fasted conditions.
Elimination
Following a single 80 mg dose under fasted conditions, median elimination half-life was 70.2 hours (range 37.1 to 92.2 hours) for elafibranor, and 15.4 hours (range 9.39 to 21.7 hours) for major active metabolite GFT1007. Elafibranor mean apparent total clearance (CL/F) was 50.0 L/h after a single 80 mg dose under fasted conditions.
Metabolism
Elafibranor is extensively metabolized to form a major active metabolite, GFT1007. The mean systemic exposure (AUC) to GFT1007 was 3.2-fold higher than that of elafibranor at steady state. Additional major inactive metabolite, an acyl glucuronide conjugate GFT3351 that consisted of four stereoisomers was formed. In vitro studies showed that elafibranor was metabolized by cytosolic enzyme, 15-ketoprostaglandin 13-Δ reductase (PTGR1), to form GFT1007. Elafibranor was also metabolized by CYP2J2, and uridine diphosphate (UDP)-glucuronosyltransferase (UGT) isoforms, UGT1A3, UGT1A4, and UGT2B7. GFT1007 was further metabolized by CYP2C8 and UGT1A3 and UGT2B7.
Excretion
Following a single 120 mg oral dose (1.5-times the recommended dose) of 14C-radiolabelled elafibranor in healthy subjects, approximately 77.1% of the dose was recovered in feces, primarily as elafibranor (56.7% of the administered dose) and its major metabolite GFT1007 (6.08% of the administered dose). Approximately 19.3% was recovered in urine, primarily as glucuronide conjugate GFT3351 (11.8% of the administered dose). A negligible amount of unchanged elafibranor or GFT1007 was detectable in the urine. Biliary excretion of elafibranor in humans was suggested by the excretion of 60% of orally administered elafibranor in the bile of rats.
Specific Populations
There was no evidence that sex and body mass index (BMI) (14.5 to 53.5 kg/m²) or body weight (43 kg to 120 kg) had any clinically meaningful impact on PK of elafibranor and GFT1007.
Age
Following single dose 120 mg elafibranor administration (1.5-times the recommended dose), the AUCinf of elafibranor and GFT1007 was 23% and 51% higher, respectively in healthy elderly subjects (age range 75-80 years) than in healthy young subjects (age 26-42 years) [see Use in Specific Populations (8.5)].
Patients with Renal Impairment
Following a single dose of 120 mg elafibranor administration (1.5-times the recommended dose), the systemic exposure of elafibranor was 32% lower and GFT1007 was not significantly different between patients with normal renal function and patients with severe renal impairment (eGFR <15 mL/min/1.73 m², Modification of Diet in Renal Disease (MDRD)) but not yet on dialysis. The unbound fraction of elafibranor was 21% lower and GFT1007 was not significantly different between patients with normal renal function and patients with severe renal impairment [see Use in Specific Populations (8.6)].
Patients with Hepatic Impairment
Following a single dose 120 mg elafibranor administration (1.5-times the recommended dose), no clinically significant differences in the pharmacokinetics of elafibranor or GFT1007 (mean change <30%) were observed in patients with hepatic impairment (Child-Pugh A, B and C). However, the unbound fraction of elafibranor and GFT1007 was significantly increased by 2-fold and 2.6-fold, respectively, in patients with severe hepatic impairment (Child-Pugh C) [see Use in Specific Populations (8.7)].
Drug Interactions
Effect of IQIRVO on the Pharmacokinetics of Other Drugs
In vitro Studies:
Elafibranor, GFT1007 and GFT3351 did not inhibit CYP1A2, CYP2B6, CYP2C8, CYP2C9, CYP2C19, CYP2D6, and CYP3A4. No time dependent CYP inhibition is observed. Elafibranor and GFT1007 did not induce CYP1A2, CYP2B6, and CYP3A4. The CYP induction potential for GFT3351 was not assessed.
Elafibranor is not expected to inhibit UGT1A1, 1A3, 1A4, 1A6, 1A9, 2B7, 2B10, and 2B15 at the clinically relevant concentrations. GFT1007 is not expected to inhibit UGT1A1, 1A3, 1A4, 1A9, 2B7, 2B10, and 2B15 at the clinically relevant concentrations.
GFT1007 inhibited UGT1A6 but the clinical relevance of UGT1A6 inhibition is unknown.
Elafibranor is an inhibitor of bile salt export pump (BSEP) and breast cancer resistance protein (BCRP) and the clinical significance of BSEP and BCRP inhibition by elafibranor is unknown.
GFT3351 is an inhibitor of multidrug resistance associated protein 2 (MRP2) and MRP3 and the clinical significance of MRP2 and MRP3 inhibition by GFT3351 is unknown.
Elafibranor did not inhibit permeability-glycoprotein/multidrug resistance protein 1 (P-gp/MDR1), organic anion transporting polypeptides 1B1 (OATP1B1), organic cation transporter 1 (OCT1), OCT2, organic anion transporter 1 (OAT1), multidrug and toxin extrusion protein 1 (MATE1), MATE2-K and OAT3 and OATP1B3.
GFT1007 did not inhibit OAT3, OATP1B3, BSEP, P-gp/MDR1, BCRP, OATP1B1, OCT1, OCT2, OAT1, MATE1 and MATE2-K. GFT3351 did not inhibit BCRP, P-gp, OATP1B1, OATP1B3, OAT1, OAT2, OAT3, OCT1, OCT2, MATE1, MATE2-K, and BSEP.
Clinical Studies:
Warfarin (CYP2C9 Substrate):
No clinically significant differences in Cmax and AUC of S-warfarin and R-warfarin were observed when a single dose of warfarin 15 mg was administered with elafibranor 120 mg once daily at steady state compared to administered alone. No difference in international normalized ratio (INR) was observed.
Simvastatin (CYP3A4, OATP1B1 and OATP1B3 Substrates):
The active metabolite of simvastatin, simvastatin β-hydroxyacid Cmax decreased by 26% and AUCinf decreased by 32% following concomitant use of a single dose of simvastatin 20 mg and elafibranor 80 mg once daily at steady state. The change in simvastatin β-hydroxyacid exposure was not considered clinically meaningful. The results indicate that IQIRVO is a weak CYP3A4 inducer [see Drug Interaction (7.1)].
Atorvastatin (CYP3A, OATP1B1 and OATP1B3 Substrates):
Atorvastatin Cmax decreased by 28% and AUCinf decreased by 12% following concomitant use of a single dose of atorvastatin 40 mg and elafibranor 180 mg once daily at steady state. The change in atorvastatin exposure was not considered clinically meaningful.
Sitagliptin (dipeptidyl peptidase-IV (DPP-IV) Inhibitor):
In healthy subjects, no significant differences in plasma glucose and glucagon-like peptide-1 (GLP-1) were observed when elafibranor 120 mg was co-administered with sitagliptin 75 mg BID in comparison to administering sitagliptin alone. The relevance of the results to patients is unclear.
Effect of Other Drugs on the Pharmacokinetics of IQIRVO
In vitro Studies:
Elafibranor is a substrate of PTGR1 as well as CYP2J2 and UGT enzymes (e.g., UGT1A3, UGT1A4, and UGT2B7). GFT1007 is a substrate of CYP2C8 and UGT enzymes (e.g., UGT1A3 and UGT2B7).
Elafibranor is a substrate for MRP2 and BCRP. Potential impact of concomitant MRP2 or BCRP inhibitors was not studied in humans; thus, the clinical significance is unknown. GFT1007 is not a substrate for BCRP or MRP2. Neither elafibranor nor GFT1007 is a substrate of P-gp, OATP1B1, OATP1B3, OAT1, OAT3 and OCT2.
Clinical Study:
Indomethacin (PTGR1 Inhibitor):
No clinically significant differences in the pharmacokinetics (Cmax and AUC) of elafibranor and GFT1007 were observed when a single dose of elafibranor 120 mg was administered with indomethacin 75 mg after indomethacin was administered alone twice daily for 5 days.
13.1. Carcinogenesis, Mutagenesis, Impairment of Fertility
Carcinogenesis
In a 2-year study in CD-1 mice, oral administration of elafibranor produced hepatocellular tumors (adenoma or carcinoma) in both sexes at doses of 1, 3, 10, and 30 mg/kg/day (0.007 to 0.14 times the recommended dose in males and 0.003 to 0.16 times the recommended dose in females based on combined AUC for elafibranor and GFT1007).
In a 2-year study in Sprague-Dawley rats, oral administration of elafibranor produced hepatocellular tumors (adenoma or carcinoma) at 10 mg/kg/day and higher in males (0.36 times the recommended dose based on combined AUC for elafibranor and GFT1007) and at 30 mg/kg/day in females (2.1 times the recommended dose based on combined AUC for elafibranor and GFT1007). In males, elafibranor also produced pancreatic acinar cell adenoma and testicular Leydig cell adenoma at 30 mg/kg/day (2.1 times the recommended dose based on combined AUC for elafibranor and GFT1007).
The liver tumors in mice and rats may be attributed to the expected rodent-specific PPARα-related liver toxicity and its related consequences. Therefore, the relevance to humans is uncertain.
Mutagenesis
Elafibranor was negative in the in vitro bacterial reverse mutation (Ames) assay, the in vivo rat micronucleus assay, and the in vivo rat comet assay. Elafibranor was mutagenic in L5178Y tk+/- mouse lymphoma cells in the absence or presence of metabolic activation and it induced the formation of micronuclei in this cell line in the presence of metabolic activation.
The metabolites GFT1007 and racemic GFT3351 were both negative in the in vitro bacterial reverse mutation (Ames) assay. GFT1007 tested negative in the in vitro micronucleus assay in L5178Y tk+/- mouse lymphoma cells, and GFT3351 tested negative in the in vitro micronucleus assay in human lymphocytes.
The overall data and weight-of-evidence from the comprehensive battery of in vivo and in vitro genotoxicity assays conducted for elafibranor, its principal active metabolite GFT1007, and the acyl glucuronide metabolite racemic GFT3351 indicate that the parent drug and its tested metabolites are unlikely to have genotoxic potential.
Impairment of Fertility
Elafibranor produced no adverse effects on rat fertility or early embryonic development at oral doses up to 100 mg/kg/day (5.9 times the recommended dose in females and 7.4 times the recommended dose in males based on combined AUC for elafibranor and GFT1007).
14. Clinical Studies
The efficacy of IQIRVO was evaluated in Study 1 (NCT04526665), a multi-center, randomized, double-blind, placebo-controlled study. The study included 161 adults with PBC with an inadequate response or intolerance to UDCA. Patients were randomized to receive IQIRVO 80 mg (n=108) or placebo (n=53) once daily for at least 52 weeks. When applicable, patients continued their pre-study dose of UDCA throughout the study. Patients were included in the study if their ALP was greater than or equal to 1.67-times the ULN and TB was less than or equal to 2-times the ULN. Patients were excluded if they had other liver disease or in case of decompensated cirrhosis.
The mean age of patients in Study 1 was 57 (Range: 36, 76) years, and the mean weight was 70.8 (Range: 43, 134) kg. The study population was predominately female (96%) and White (91%). The baseline mean ALP concentration was 321.9 (Range: 151, 1398) U/L, and 39% of patients had a baseline ALP concentration greater than 3-times the ULN.
The mean baseline TB concentration was 0.56 (Range: 0.15, 1.76) mg/dL, and 96% of patients had a baseline TB concentration less than or equal to ULN. The baseline mean concentration of ALT was 50 (Range: 11 to 188) U/L and mean baseline concentration for AST was 46 (Range: 14 to 203) U/L.
Most patients (95%) received study treatment (IQIRVO or placebo) in combination with UDCA. There were 6 (6%) in the IQIRVO-treated patients and 2 (4%) in the placebo-treated patients who were unable to tolerate UDCA and received IQIRVO as monotherapy. At baseline, 12 (11%) of the IQIRVO-treated patients and 8 (15%) of the placebo-treated patients met at least one of the following criteria: serum albumin <3.5g/dL, INR >1.3, TB >1-time ULN, Fibroscan >16.9 kPa, or historical biopsy suggestive of cirrhosis.
The primary endpoint was biochemical response at Week 52, where biochemical response was defined as achieving ALP less than 1.67-times ULN, TB less than or equal to ULN, and ALP decrease greater than or equal to 15% from baseline. The ULN for ALP was defined as 129 U/L for males and 104 U/L for females. The ULN for TB was defined as 1.20 mg/dL. ALP normalization (i.e., ALP less than or equal to ULN) at Week 52 was a key secondary endpoint.
Table 6 presents results at Week 52 for the percentage of patients who achieved biochemical response, achieved each component of biochemical response, and achieved ALP normalization. IQIRVO demonstrated greater improvement on biochemical response and ALP normalization at Week 52 compared to placebo. Overall, 96% of patients had a baseline TB concentration less than or equal to ULN. Therefore, improvement in ALP was the main contributor to the biochemical response rate results at Week 52.
Table 6. Percentage of Adult Patients with PBC Achieving Biochemical Response and ALP Normalization at Week 52 in Study 1a:
| IQIRVO 80mg Once Daily (N=108) | Placebo (N=53) | Treatment Difference, % (95% CI)e | |
|---|---|---|---|
| Biochemical response rate, n (%)b | 55 (51) | 2 (4) | 47 (32, 57) |
|   |   |   |   |
| Components of biochemical response |   |   |   |
| ALP less than 1.67-times ULN, n (%) | 56 (52) | 5 (9) | 42 (27, 53) |
| Decrease in ALP of at least 15%, n (%) | 81 (75) | 9 (17) | 58 (43, 69) |
| TB less than or equal to ULN, n (%)c | 92 (85) | 44 (83) | 2 (-9, 16) |
|   |   |   |   |
| ALP normalization, n (%)d | 16 (15) | 0 (0) | 15 (6, 23) |
a Patients who prematurely stopped the study treatment or used rescue therapy for PBC prior to the Week 52 assessment were considered non-responders. For two other patients with missing data at Week 52, the closest non-missing assessment from the double-blind treatment period was used.
b Biochemical response is defined as ALP <1.67-times ULN and TB ≤ULN and ALP decrease from baseline ≥15% at Week 52. The pvalue from the exact Cochran–Mantel–Haenszel (CMH) test was <0.0001.
c The mean baseline total bilirubin was 0.56 mg/dL, and was less than or equal to the ULN in 96% of the enrolled patients.
d Normalization of ALP at Week 52 is defined as ALP ≤1-time ULN. The p-value from the exact CMH test was 0.0019. e For biochemical response and its components: calculated using the Newcombe method stratified by (1) ALP >3-times ULN or TB > ULN (Yes/No) and (2) 14-day baseline average PBC Worst Itch Numeric Rating Scale score ≥4 (Yes/No). For ALP normalization: calculated using unstratified Newcombe method.
Figure 1 depicts the mean (95% confidence interval) ALP levels over 52 weeks. There was a trend of lower ALP in the IQIRVO group compared to the placebo group starting by Week 4 through Week 52.
Figure 1. Mean ALP (+/- 95% Confidence Interval) in Adult Patients with PBC Over 52 Weeks in Study 1:
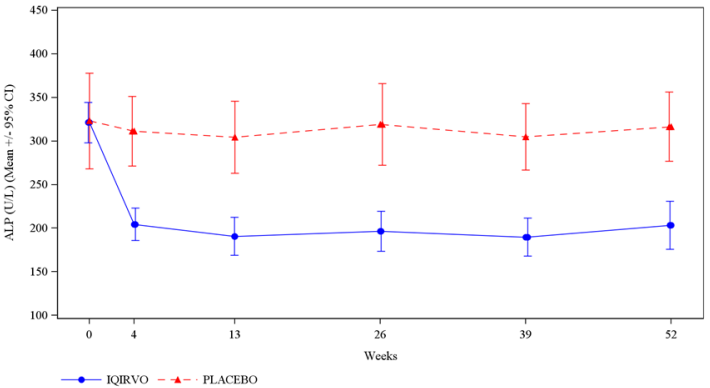
Missing data and data following study treatment discontinuation was imputed by multiple imputation.
© All content on this website, including data entry, data processing, decision support tools, "RxReasoner" logo and graphics, is the intellectual property of RxReasoner and is protected by copyright laws. Unauthorized reproduction or distribution of any part of this content without explicit written permission from RxReasoner is strictly prohibited. Any third-party content used on this site is acknowledged and utilized under fair use principles.