QALSODY Solution for injection Ref.[110458] Active ingredients: Tofersen
Source: European Medicines Agency (EU) Revision Year: 2024 Publisher: Biogen Netherlands B.V., Prins Mauritslaan 13, 1171 LP Badhoevedorp, The Netherlands
5.1. Pharmacodynamic properties
Pharmacotherapeutic group: Other nervous system drugs
ATC code: N07XX22
SOD1-ALS is a primarily autosomal-dominant disorder affecting approximately 2% of the ALS population. Mutations in the SOD1 gene lead to accumulation of a toxic form of SOD1 protein. Over 200 unique SOD1 mutations associated with ALS have been identified with a median disease duration of approximately 2.3 years.
Mechanism of action
The human SOD1 gene encodes an abundant dimeric enzyme, copper/zinc superoxide dismutase (Cu/ZnSOD or SOD1), which catalyses the transmutation of superoxide (O2-) into oxygen (O2) and hydrogen peroxide (H2O2). In SOD1-ALS patients, mutations in the SOD1 gene lead to accumulation of a toxic form of SOD1 protein, resulting in axonal injury and neurodegeneration.
Tofersen is an antisense oligonucleotide (ASO) that is complementary to a portion of the 3′ untranslated region (3′UTR) of the mRNA for human SOD1 and binds to the mRNA by Watson-Crick base pairing (hybridisation). This hybridisation of tofersen to the cognate mRNA results in RNase-Hmediated degradation of the mRNA for SOD1, which reduces the amount of SOD1 protein synthesis.
Pharmacodynamic effects
Total CSF SOD1 protein
Total CSF SOD1 was measured in Studies 101 Part C (VALOR) and 102 as an indirect measure of target engagement.
At Week 28 in Study 101 Part C, a reduction in total CSF SOD1 protein of 35% (geometric mean ratio to baseline) in the tofersen-treated group versus a 2% decrease from baseline in the corresponding placebo participants in the ITT population was observed (difference in geometric mean ratios for tofersen to placebo: 34% (95% CI: 23%, 43%). Total CSF SOD1 declined until approximately Day 56, after which the reductions were sustained over time.
Plasma neurofilament light chain (NfL) biomarker
Plasma neurofilament light chain (NfL) was measured in Studies 101 Part C (VALOR) and 102 as a marker of axonal injury and neurodegeneration.
At Week 28 in Study 101 Part C, mean plasma NfL was reduced 55% (geometric mean ratio to baseline) in the tofersen-treated participants (ITT), compared to a 12% increase with placebo (difference in geometric mean ratios for tofersen to placebo: 60% (95% CI: 51%, 67%)). Plasma NfL levels declined until approximately Day 113, after which the reductions were sustained over time. The reductions in CSF NfL were consistent compared to those observed in plasma.
Figure 1. Study 101 Part C: plasma NfL adjusted geometric mean ratio to baseline values by study week for the ITT population:
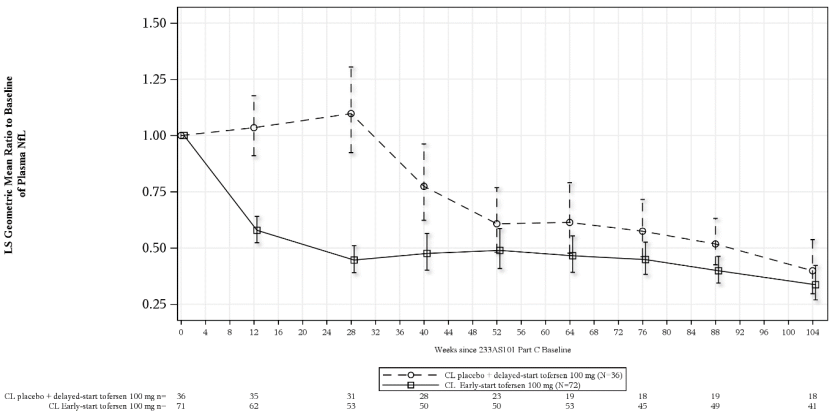
Abbreviations: NfL = neurofilament light chain; ANCOVA = analysis of covariance; MI = multiple imputation; LS = least square.
Note 1: Baseline is defined as day 1 value prior to the clinical study drug. If day 1 value is missing, the non-missing value (including screening visit) closest to and prior to the first dose will be used as the baseline value.
Note 2: Values below limit of quantitation (BLQ) are set to half of lower limit of quantitation (LLOQ, 4.9 pg/mL) in calculations. Multiple imputation is used for missing data.
Note 3: The ITT analysis is based on ANCOVA model with natural log transformed data. The model includes covariates for the corresponding baseline value i.e. log value, baseline disease duration since symptom onset, and use of riluzole or edaravone.
Note 4: The table at the bottom presents the number of participants with observed non-missing data at each visit.
Cardiac electrophysiology
ECG measurements and the values for the tofersen 100 mg group (n=41) were similar to placebo group (n=34) in Study 101 Part C. The incidence of abnormalities in ECG measurements was higher in the tofersen group compared to the placebo group, with 8 participants (11.3%) displaying a maximum increase from baseline in Fridericia formula (QTcF) >30 to 60 ms in the tofersen group compared to 2 participants (5.6%) in the placebo group. The clinical significance of this imbalance is not known. No participants in the tofersen or placebo group displayed an increase from baseline in QTcF >60 ms, and no participants displayed maximum postbaseline QTcF >480 ms.
Immunogenicity
Anti-drug antibodies (ADA) were very commonly detected. No evidence of ADA impact on efficacy or safety was observed. However, data are still limited.
Clinical efficacy and safety
The efficacy of tofersen was assessed in a 28-week randomised, double-blind, placebo-controlled clinical study (Study 101, Part C) in participants aged 23 to 78 years with weakness attributable to ALS and a SOD1 mutation confirmed by central laboratory. One hundred eight (108) participants were randomised 2:1 to receive treatment with either tofersen 100 mg or placebo for 24 weeks (3 loading doses followed by 5 maintenance doses). Forty-two (42) unique SOD1 mutations were evaluated, with the most common being p.Ile114Thr (n=20), p.Ala5Val (n=17), p.Gly94Cys (n=6), and p.His47Arg (n=5). Concomitant riluzole and/or edaravone use was permitted for participants who were on a stable dose for at least 30 or 60 days prior to study baseline, respectively.
Baseline disease characteristics in the overall intent to treat (ITT) population were generally similar in the tofersen-treated participants (n=72) and placebo participants (n=36), with a baseline ALS Functional Rating Scale–Revised (ALSFRS-R) total score of 36.9 (SD: 5.9) in the tofersen group and 37.3 (SD: 5.81) in the placebo group. The tofersen group had a shorter median time from symptom onset (11.4 months; range: 1.7, 145.7) as compared to the placebo group (14.6 months; range: 2.4, 103.2), and a higher median baseline plasma NfL level (78.5 pg/mL; range 5 to 329) as compared to the placebo group (64.6 pg/mL; range: 8 to 370).
The primary efficacy endpoint was the change from baseline to Week 28 in the ALSFRS-R total score The results numerically favoured tofersen, but were not statistically significant (ITT population: tofersen-placebo adjusted mean difference [95% CI]: 1.4 [-1.3, 4.1]). Numerically larger differences were observed between tofersen and placebo over 28 weeks in patients with baseline NfL values above median [mean difference (95% CI) 3.9, (-1.0;8.9)] compared to patients with baseline NfL values below median [0.6, (-1.3,4.2)]. Secondary clinical outcomes also did not reach statistical significance.
Paediatric population
The European Medicines Agency has waived the obligation to submit the results of studies with tofersen in all subsets of the paediatric population in ALS (see section 4.2 for information on paediatric use). This medicinal product has been authorised under ‘exceptional circumstances’. This means that due to the rarity of the disease it has not been possible to obtain complete information on this medicinal product. The European Medicines Agency will review any new information which may become available every year and this SmPC will be updated as necessary.
5.2. Pharmacokinetic properties
The single and multidose pharmacokinetics of tofersen, administered via intrathecal injection, were characterised in plasma and CSF of adult ALS participants with a SOD1 mutation and in autopsy tissue from deceased clinical study participants (n=3).
Absorption
The maximum CSF trough concentration occurred at the third dose, which was the last dose of the loading period. There was little to no accumulation with monthly dosing after the loading phase; the accumulation ratio appears to be less than 2-fold. Tofersen is rapidly transferred from CSF into the systemic circulation, with a median time to maximum concentration (Tmax) plasma values ranged from 2 to 6 hours post intrathecal (IT) administration. There was no accumulation in plasma exposure measures (Cmax and AUC) after monthly maintenance dosing.
Distribution
Tofersen administered intrathecally was extensively distributed within the CNS, achieving therapeutic levels in the target spinal cord tissues. The median plasma AUC at 100 mg (Study 101 Part C data) after first dose was 13973.1 ng/mL*h; median maximum plasma concentration (Cmax) was 824.3 ng/mL, which occurred at between 4-6 hours post dose. The median plasma volume of distribution was estimated at 50.9L (119% CV) in study 101 and 102; and was 40.67 L (130% CV) in the 100 mg dose group. Pharmacokinetic (PK) analysis demonstrates that intrathecally administered tofersen is widely distributed into central nervous system (CNS) tissues and is rapidly transferred from CSF to the systemic circulation.
Plasma Protein Binding
Tofersen is highly bound to human plasma proteins (≥98% bound) at clinically relevant or higher plasma concentrations (0.1 and 3 µg/ml), which limits glomerular filtration and reduces urinary excretion of the active substance. The likelihood of drug-drug interactions due to competition with plasma protein binding is very low.
Biotransformation
Tofersen is metabolised through exonuclease (3'- and 5')-mediated hydrolysis and is not a substrate for, or inhibitor or inducer of CYP450 enzymes.
Elimination
The primary route of elimination is expected via urinary excretion of unchanged tofersen and its metabolites. Although CNS tissue half-life cannot be measured in humans, the mean terminal elimination half-life was measured in the CNS tissue of cynomolgus monkeys and found to be 31 to 40 days. The median plasma clearance was estimated at 8.32 L/hr (60.6% CV) in study 101 and 102; and was 5.73L/hr 60% CV) at 100 mg dose.
Linearity/non-linearity
In CSF, the pharmacokinetics of tofersen administered IT increase less than dose proportional for dose ranging from 20 mg to 100 mg. In plasma, the pharmacokinetics of tofersen administered IT increase more than dose proportional for dose ranging from 20 mg to 100 mg.
Immunogenicity
The presence of anti-drug antibodies (ADAs) appeared to decrease plasma clearance by 28.0%.
Characteristics in specific patient populations
Elderly
Of the 166 patients who received tofersen in clinical studies, a total of 22 patients were 65 years of age and older, including 2 patients 75 years of age and older. No overall differences in clinical PK were observed between these patients, but data are limited.
Renal impairment
The pharmacokinetics of tofersen in patients with renal impairment has not been studied.
Hepatic impairment
The pharmacokinetics of tofersen in patients with hepatic impairment has not been studied.
5.3. Preclinical safety data
Carcinogenesis
Carcinogenicity studies with tofersen have not been performed.
Mutagenesis
Tofersen demonstrated no evidence of mutagenicity based on nonclinical genotoxicity studies (in vitro Ames bacterial mutagenicity, in vitro chromosome aberration, and in vivo mouse micronucleus assays).
Reproductive toxicity
Reproductive toxicology studies were conducted using subcutaneous administration of tofersen in mice and rabbits. In a mice fertility and embryo-fetal development study, male mice in the high dose group of 30 mg/kg (> 50 times the human exposure [AUC] following 100 mg tofersen) had minimal to mild seminiferous tubular degeneration, seminiferous tubule dilatation, spermatid retention, apoptosis of epithelial cells, increased cellular debris in the testes, and hypospermia in the epididymis. However, there were no tofersen-related adverse effects on mating and fertility or sperm parameters. In female mice, there was no tofersen-related mortality or early delivery and there were no effects on mating or fertility. No tofersen-related adverse effects on embryo-foetal development were observed in mice and rabbits (at exposures more than 40-times the human exposure at MRHD). In a perinatal/postnatal reproduction study in mice, there were no adverse effects on the F0 females or on the growth and development of the F1 pups at the highest dose evaluated (30 mg/kg). Tofersen was detected in mouse milk samples from all tofersen-dosed animals. Tofersen is not pharmacologically active in mice and rabbits, which limits the validity of these studies, as harmful effects associated with SOD1 downregulation cannot be evaluated therein.
Microscopic evaluation of reproductive tissues from both males and females in the 13-week and 39- week non-human primate (NHP) toxicology studies in which tofersen is pharmacologically active revealed no effects on the reproductive tissues.
Toxicology
In a repeat-dose toxicology study (9 months), intrathecal administration of tofersen to adult cynomolgus monkeys was generally well-tolerated. The exception was a female in the high dose group (35 mg; equivalent to 350 mg per IT injection in humans) that had behaviour described as muscle cramping, head/neck dorsiflexion, and opisthotonos-like-back-arching posture after IT dosing. Electroencephalogram (EEG) indicated the absence of seizure. The no observed adverse effect levels (NOAELs) in the repeat-dose chronic toxicology studies were 150 mg/kg subcutaneous administration in the mouse and 12 mg intrathecal administration in the 9-month nonhuman primate. Using the nonhuman primate as the most sensitive species, a dose of 12 mg converts to the human equivalent dose (HED) of 120 mg (based on the monkey-to-human CSF volume scaling). The safety margin (1.2-fold) for the IT doses in monkeys to IT doses in humans is based on the converted HED with consideration of volume difference in CSF (approximately 10-fold between human and monkeys). Therefore, no toxicity effects were seen at dose levels equivalent to 120 mg in humans.
© All content on this website, including data entry, data processing, decision support tools, "RxReasoner" logo and graphics, is the intellectual property of RxReasoner and is protected by copyright laws. Unauthorized reproduction or distribution of any part of this content without explicit written permission from RxReasoner is strictly prohibited. Any third-party content used on this site is acknowledged and utilized under fair use principles.