BLINCYTO Powder and solution for solution for infusion Ref.[6566] Active ingredients: Blinatumomab
Source: European Medicines Agency (EU) Revision Year: 2025 Publisher: Amgen Europe B.V., Minervum 7061, 4817 ZK Breda, The Netherlands
5.1. Pharmacodynamic properties
Pharmacotherapeutic group: Antineoplastic agents, other monoclonal antibodies and antibody drug conjugates
ATC code: L01FX07
Mechanism of action
Blinatumomab is a bispecific T-cell engager molecule that binds specifically to CD19 expressed on the surface of cells of B-lineage origin and CD3 expressed on the surface of T-cells. It activates endogenous T-cells by connecting CD3 in the T-cell receptor (TCR) complex with CD19 on benign and malignant B-cells. The anti-tumour activity of blinatumomab immunotherapy is not dependent on T-cells bearing a specific TCR or on peptide antigens presented by cancer cells, but is polyclonal in nature and independent of human leukocyte antigen (HLA) molecules on target cells. Blinatumomab mediates the formation of a cytolytic synapse between the T-cell and the tumour cell, releasing proteolytic enzymes to kill both proliferating and resting target cells. Blinatumomab is associated with transient upregulation of cell adhesion molecules, production of cytolytic proteins, release of inflammatory cytokines, and proliferation of T-cells, and results in elimination of CD19+ cells.
Pharmacodynamic effects
Consistent immune-pharmacodynamic responses were observed in patients studied. During the continuous intravenous infusion over 4 weeks, the pharmacodynamic response was characterised by T-cell activation and initial redistribution, rapid peripheral B-cell depletion, and transient cytokine elevation.
Peripheral T-cell redistribution (i.e. T-cell adhesion to blood vessel endothelium and/or transmigration into tissue) occurred after start of blinatumomab infusion or dose escalation. T-cell counts initially declined within 1 to 2 days and then returned to baseline levels within 7 to 14 days in the majority of patients. Increase of T-cell counts above baseline (T-cell expansion) was observed in few patients.
Peripheral B-cell counts decreased rapidly to an undetectable level during treatment at doses ≥5 mcg/m²/day or ≥9 mcg/day in the majority of patients. No recovery of peripheral B-cell counts was observed during the 2-week treatment-free period between treatment cycles. Incomplete depletion of B-cells occurred at doses of 0.5 mcg/m²/day and 1.5 mcg/m²/day and in a few non-responders at higher doses.
Peripheral lymphocytes were not measured in paediatric subjects.
Cytokines including IL-2, IL-4, IL-6, IL-8, IL-10, IL-12, TNF-α and IFN-γ were measured and, IL-6, IL-10 and IFN-γ were most elevated. Transient elevation of cytokines was observed in the first 2 days following start of blinatumomab infusion. The elevated cytokine levels returned to baseline within 24 to 48 hours during the infusion. In subsequent treatment cycles, cytokine elevation occurred in fewer patients with lesser intensity compared to the initial 48 hours of the first treatment cycle.
Clinical efficacy and safety
Philadelphia chromosome-negative relapsed or refractory B-cell precursor ALL
A total of 456 patients aged ≥ 18 years of age with relapsed or refractory B-cell precursor ALL were exposed to BLINCYTO during the phase II and phase III clinical studies described below.
The safety and efficacy of BLINCYTO compared to standard of care (SOC) chemotherapy were evaluated in a randomised, open-label, multicentre, phase III study (TOWER). Eligible patients were ≥18 years of age and ECOG status ≤2 with relapsed or refractory B-cell precursor ALL (had >5% blasts in the bone marrow and either relapse at any time after allogeneic HSCT, untreated first relapse with first remission duration <12 months, or refractory to last therapy).
Patients were randomised 2:1 to receive BLINCYTO or 1 of 4 prespecified, investigator-selected, SOC backbone chemotherapy regimens. Randomisation was stratified by age (<35 years versus ≥35 years of age), prior salvage therapy (yes versus no), and prior allogeneic HSCT (yes versus no) as assessed at the time of consent. The demographics and baseline characteristics were well-balanced between the two arms (see table 3).
Table 6. Demographics and baseline characteristics in phase III study (TOWER):
| Characteristic | BLINCYTO (N=271) | SOC chemotherapy (N=134) |
|---|---|---|
| Age | ||
| Median, years (min, max) | 37 (18, 80) | 37 (18, 78) |
| Mean, years (SD) | 40.8 (17.1) | 41.1 (17.3) |
| ≥65 Years, n (%) | 33 (12.2) | 15 (11.2) |
| Prior salvage therapy | 164 (60.5) | 80 (59.7) |
| 0 | 114 (42.1) | 65 (48.5) |
| 1 | 91 (33.6) | 43 (32.1) |
| ≥2 | 66 (24.3) | 26 (19.4) |
| Prior alloHSCT | 94 (34.7) | 46 (34.3) |
| ECOG status - n (%) | ||
| 0 | 96 (35.4) | 52 (38.8) |
| 1 | 134 (49.4) | 61 (45.5) |
| 2 | 41 (15.1) | 20 (14.9) |
| Refractory status - n (%) | ||
| Primary refractory | 46 (17.0) | 27 (20.1) |
| Refractory to salvage therapy | 87 (32.1) | 34 (25.4) |
| Maximum of central/local bone marrow blasts - n (%) | ||
| ≥50% | 201 (74.2) | 104 (77.6) |
AlloHSCT = allogeneic haematopoietic stem cell transplantation
SOC = standard of care
BLINCYTO was administered as a continuous intravenous infusion. In the first cycle, the initial dose was 9 mcg/day for week 1, then 28 mcg/day for the remaining 3 weeks. The target dose of 28 mcg/day was administered in cycle 2 and subsequent cycles starting on day 1 of each cycle. Dose adjustment was possible in case of adverse reactions. Of the 267 patients who received BLINCYTO, the mean number of completed treatment cycles was 2.0; of the 109 patients who received SOC chemotherapy, the mean number of treatment cycles was 1.3.
The primary endpoint was overall survival (OS). The median OS was 4.0 months (95% CI: 2.9, 5.3) in the SOC chemotherapy arm compared with 7.7 months (95% CI: 5.6, 9.6) in the BLINCYTO arm. The hazard ratio (95% CI) was 0.71 (0.55, 0.93) between treatment arms favouring BLINCYTO, indicated a 29% reduction in hazard rate in the BLINCYTO arm (p-value = 0.012 (stratified log-rank test)), see figure 1. Consistency in OS results was shown in subgroups by stratification factors.
Consistent results were observed after censoring at the time of HSCT; median OS, censored at the time of HSCT, was 6.9 months (95% CI: 5.3, 8.8) in the BLINCYTO group and 3.9 months (95% CI: 2.8, 4.9) in the SOC group (HR, 0.66; 95% CI: 0.50, 0.88; p-value = 0.004). The mortality rate following alloHSCT among all responders who did not receive anti-leukaemic therapy was 10/38 (26.3%; 95% CI: 13.4, 43.1) in the BLINCYTO group and 3/12 (25%; 95% CI: 5.5, 57.2) in the SOC group; such mortality rate at 100 days post alloHSCT was 4/38 (12.4%; 95% CI: 4.8%, 29.9%) in the BLINCYTO group and 0/12 (0%; 95% CI: not estimable) in the SOC group. Efficacy results from other key endpoints in the study are summarised in table 7.
Figure 1. Kaplan-Meier curve of overall survival:

Table 7. Efficacy results in patients ≥18 years of age with Philadelphia chromosome-negative relapsed or refractory B-cell precursor ALL (TOWER):
| BLINCYTO (N=271) | SOC chemotherapy (N=134) | |
|---|---|---|
| Complete remission (CR) | ||
| CRa/CRh*b/CRic, n (%) [95% CI] | 119 (43.9) (37.9, 50.0) | 33 (24.6) (17.6, 32.8) |
| Treatment difference [95% CI] | 19.3 (9.9, 28.7) | |
| p-value | <0.001 | |
| CR, n (%) [95% CI] | 91 (33.6) (28.0, 39.5) | 21 (15.7) (10.0, 23.0) |
| Treatment difference [95% CI] | 17.9 (9.6, 26.2) | |
| p-value | <0.001 | |
| Event-free survivald | ||
| 6-month estimate % [95% CI] | 30.7 (25.0, 36.5) | 12.5 (7.2, 19.2) |
| 18-months estimate % [95% CI] | 9.5 (5.1, 15.6) | 7.9 (3.7, 14.2) |
| HR [95% CI] | 0.55 (0.43, 0.71) | |
| Duration of haematological response - Median time to event [95% CI] | ||
| CR | 8.3 (5.7, 10.7) | 7.8 (2.2, 19.0) |
| CR/CRh*/CRi | 7.3 (5.8, 9.9) | 4.6 (1.8, 19.0) |
| MRDe response for CR/CRh*/CRi | ||
| MRD evaluable patients (%) [95% CI]f | 74/97 (76.3) (66.6, 84.3) | 16/33 (48.5) (30.8, 66.5) |
| Duration of MRD response - Median time to event [95% CI] | 4.5 months (3.6, 9.0) | 3.8 months (1.9, 19.0) |
| Postbaseline alloHSCT - n (%) | ||
| Overall subjects | 65 (24) | 32 (23.9) |
| Haematological responders (CR/CRh*/CRi) | 50 (42.0) | 18 (54.5) |
| Time to alloHSCT among all transplanted patients Median time to event (Interquartile range) | 3.7 months (3.0, 5.3) (N=65) | 3.1 months (2.6, 4.3) (N=32) |
| Time to alloHSCT among CR/CRh*/CRi responders Median time to event [95% CI] (KM estimate) | 11.3 months (5.2, NE) (N=119) | 3.6 months (2.3, 7.2) (N=33) |
| 100 day mortality after alloHSCT | ||
| n/N (%) , [95% CI] | 4/38, 12.4% (4.8, 29.9) | 0/12, 0.0% (0.0, NE) |
a CR was defined as ≤5% blasts in the bone marrow, no evidence of disease, and full recovery of peripheral blood counts (platelets >100 000/microlitre and absolute neutrophil counts [ANC] >1 000/microlitre).
b CRh* (complete remission with partial haematologic recovery) was defined as ≤5% blasts in the bone marrow, no evidence of disease, and partial recovery of peripheral blood counts (platelets >50 000/microlitre andANC >500/microlitre).
c CRi (complete remission with incomplete haematologic recovery) was defined as ≤5% blasts in the bone marrow, no evidence of disease, and incomplete recovery of peripheral blood counts (platelets >100 000/microlitre or ANC >1 000/microlitre).
d EFS time was calculated from the time of randomisation until the date of disease assessment indicating a relapse after achieving a CR/CRh*/CRi or death, whichever is earlier. Subjects who fail to achieve a CR/CRh*/CRi within 12 weeks of treatment initiation are considered treatment failures and assigned an EFS duration of 1 day.
e MRD (minimum residual disease) response was defined as MRD by PCR or flow cytometry <1 × 10⁻⁴.
f Patients who achieved CR/CRh*/CRi and had an evaluable post baseline MRD assessment.
Health-related quality of life
In this open-label study, Health related quality of life (HRQoL) reported by patients were measured using the European Organisation for Research and Treatment of Cancer Quality of Life Questionnaire - Core 30 (EORTC QLQ-C30). In a post-hoc sensitivity analysis, compared to SOC, BLINCYTO consistently delayed the time to clinically meaningful deterioration of HRQoL (≥10-points worsening from baseline) for global health status [median BLINCYTO versus SOC: 8.1 months versus 1.0 month; HR = 0.60 (95% CI = 0.42, 0.85)], functional scales, symptom scales and individual items. Because the health-related quality of life results are based on a post-hoc sensitivity analysis, the results should be interpreted with caution.
BLINCYTO was also evaluated in an open-label, multicentre, single-arm phase II study of 189 patients (MT103-211). Eligible patients were ≥18 years of age with Philadelphia chromosome-negative relapsed or refractory B-cell precursor ALL (relapsed with first remission duration of ≤12 months in first salvage, or relapsed or refractory after first salvage therapy, or relapsed within 12 months of allogeneic HSCT, and had ≥10% blasts in bone marrow).
Premedication, BLINCYTO dose per treatment cycle and route of administration were identical to those in the phase III study. Patients were premedicated with a mandatory cerebrospinal fluid prophylaxis consisting of an intrathecal regimen according to institutional or national guidelines within 1 week prior to start of BLINCYTO treatment. BLINCYTO was administered as a continuous intravenous infusion. In the first cycle, the initial dose was 9 mcg/day for week 1, then 28 mcg/day for the remaining 3 weeks. The target dose of 28 mcg/day was administered in cycle 2 and subsequent cycles starting on day 1 of each cycle. Dose adjustment was possible in the case of adverse reactions. The treated population included 189 patients who received at least 1 infusion of BLINCYTO; the mean number of cycles per patient was 1.6. Patients who responded to BLINCYTO but later relapsed had the option to be retreated with BLINCYTO. Among treated patients, the median age was 39 years (range: 18 to 79 years, including 25 patients ≥ 65 years of age), 64 of 189 (33.9%) had undergone HSCT prior to receiving BLINCYTO and 32 of 189 (16.9%) had received more than 2 prior salvage therapies.
The primary endpoint was the complete remission/complete remission with partial haematological recovery (CR/CRh*) rate within 2 cycles of treatment with BLINCYTO. Eighty-one of 189 (42.9%) patients achieved CR/CRh* within the first 2 treatment cycles with the majority of responses (64 of 81) occurring within 1 cycle of treatment. In the elderly population (≥65 years of age) 11 of 25 patients (44.0%) achieved CR/CRh* within the first 2 treatment cycles (see section 4.8 for safety in elderly). Four patients achieved CR during consolidation cycles, resulting in a cumulative CR rate of 35.4% (67/189; 95% CI: 28.6% - 42.7%). Thirty-two of 189 (17%) patients underwent allogeneic HSCT in CR/CRh* induced with BLINCYTO (see table 8).
Table 8. Efficacy results in patients ≥18 years of age with Philadelphia chromosome-negative relapsed or refractory B-cell precursor ALL (MT103-211):
| n (%) n=189 | 95% CI | |
|---|---|---|
| Complete remission (CR)1/Complete remission with partial haematological recovery (CRh*)2 | 81 (42.9%) | [35.7% - 50.2%] |
| CR | 63 (33.3%) | [26.7% - 40.5%] |
| CRh* | 18 (9.5%) | [5.7% - 14.6%] |
| Blast free hypoplastic or aplastic bone marrow3 | 17 (9.0%) | [5.3% - 14.0%] |
| Partial remission4 | 5 (2.6%) | [0.9% - 6.1%] |
| Relapse5-free survival (RFS) for CR/CRh* | 5.9 months | [4.8 to 8.3 months] |
| Overall survival | 6.1 months | [4.2 to 7.5 months] |
1 CR was defined as ≤5% of blasts in the bone marrow, no evidence of disease, and full recovery of peripheral blood counts (platelets >100 000/microlitre and absolute neutrophil counts [ANC] >1 000/microlitre).
2 CRh* was defined as ≤5% of blasts in the bone marrow, no evidence of disease, and partial recovery of peripheral blood counts (platelets >50 000/microlitre and ANC >500/microlitre).
3 Blast free hypoplastic or aplastic bone marrow was defined as bone marrow blasts ≤5%, no evidence of disease, insufficient recovery of peripheral blood counts: platelets ≤50 000/microlitre and/or ANC ≤500/microlitre.
4 Partial remission was defined as bone marrow blasts 6% to 25% with at least a 50% reduction from baseline.
5 Relapse was defined as haematological relapse (blasts in bone marrow greater than 5% following CR) or an extramedullary relapse.
In a prespecified exploratory analysis, 60 of 73 MRD evaluable patients with CR/CRh* (82.2%) also had a MRD response (defined as MRD by PCR <1 × 10⁻⁴).
Patients with prior allogeneic HSCT had similar response rates to those without prior HSCT, older patients had similar response rates to younger patients, and no substantial difference was observed in remission rates based on the number of lines of prior salvage treatment.
In patients with non-CNS/non-testes extramedullary disease (defined as at least 1 lesion ≥1.5 cm) at screening (N=8/189) clinical response rates (25% [95% CI: 3.2-65.1] were lower compared with patients with no evidence of extramedullary disease (N=181, 43.6% [95% CI: 36.3 - 51.2]) (see figure 2).
Patients with the highest tumour burden as measured by the percentage of bone marrow blast cells at baseline (≥90%) still had a clinically meaningful response with a CR/CRh* rate of 21.6% (95% CI: 12.9 - 32.7) (see figure 2). Patients with low tumour burden (<50%) responded best to BLINCYTO treatment with CR/CRh* rate of 72.9% (95% CI: 59.7 - 83.6).
Figure 2. Forest plot of CR/CRh* rate during the first 2 cycles for study MT103-211 (primary analysis set):

n = number of patients who achieved CR or CRh* in the first 2 cycles of treatment in the specified subgroup.
N = total number of patients in the specified subgroup.
There is limited data in patients with late first relapse of B-cell precursor ALL defined as a relapse occurring more than 12 months after first remission or more than 12 months after HSCT in the first remission. In clinical phase II studies, 88.9% (8/9) of patients with late first relapse as defined in the individual studies achieved CR/CRh* within the first 2 treatment cycles with 62.5% (6/9) achieving MRD response and 37.5% (3/9) undergoing allogeneic HSCT after treatment with BLINCYTO. The median overall survival (OS) was 17.7 months (95% CI: 3.1 - not estimable).
In the randomised, open-label, multicentre, phase III study (TOWER), 70% (7/10) of post-transplant patients in late first relapse treated with BLINCYTO compared to 20% (1/5) treated with SOC chemotherapy achieved CR/CRh* within the first 2 treatment cycles. Fifty percent (5/10) compared to 0% (0/5) achieved MRD response and 20% (2/10) compared to 40% (2/5) underwent allogeneic HSCT after treatment. The median OS was 15.6 months (95% CI: 5.5 – not estimable) for the BLINCYTO group and 5.3 months (95% CI: 1.1 – not estimable) for the SOC chemotherapy group.
Philadelphia chromosome-positive relapsed or refractory B-cell precursor ALL in adult patients
The safety and efficacy of BLINCYTO were evaluated in an open-label, multicentre, single-arm phase II study (ALCANTARA). Eligible patients were ≥18 years of age with Philadelphia chromosome-positive B precursor ALL: relapsed or refractory to at least 1 second generation or later tyrosine kinase inhibitor (TKI); OR intolerant to second generation TKI, and intolerant or refractory to imatinib mesylate.
BLINCYTO was administered as a continuous intravenous infusion. In the first cycle, the initial dose was 9 mcg/day for week 1, then 28 mcg/day for the remaining 3 weeks. The dose of 28 mcg/day was administered in cycle 2 and subsequent cycles starting on day 1 of each cycle. Dose adjustment was possible in case of adverse reactions. The treated population included 45 patients who received at least one infusion of BLINCYTO; the mean number of treatment cycles was 2.2 (see table 9 for patient demographics and baseline characteristics).
Table 9. Demographics and baseline characteristics in phase II study (ALCANTARA):
| Characteristic | BLINCYTO (N=45) |
|---|---|
| Age | |
| Median, years (min, max) | 55 (23, 78) |
| Mean, years (SD) | 52.8 (15) |
| ≥65 Years and <75 years, n (%) | 10 (22.2) |
| ≥75 Years, n (%) | 2 (4.4) |
| Males, n (%) | 24 (53.3) |
| Race, n (%) | |
| Asian | 1 (2.2) |
| Black (or African American) | 3 (6.7) |
| Other | 2 (4.4) |
| White | 39 (86.7) |
| Disease History, n (%) | |
| Prior TKI treatmenta | |
| 1 | 7 (15.6) |
| 2 | 21 (46.7) |
| ≥3 | 17 (37.8) |
| Prior salvage therapy | 31 (61.9) |
| Prior alloHSCTb | 20 (44.4) |
| Bone marrow blastsc, n (%) | |
| ≥50% to <75% | 6 (13.3) |
| ≥75% | 28 (62.2) |
a Number of patients that failed ponatinib = 23 (51.1%)
b alloHSCT = allogeneic haematopoietic stem cell transplantation
c centrally assessed
The primary endpoint was the CR/CRh* rate within 2 cycles of treatment with BLINCYTO. Sixteen out of 45 (35.6%) patients achieved CR/CRh* within the first 2 treatment cycles. Of the 16 patients with CR/CRh* in the first 2 cycles, 12 of 14 (85.7%) patients with a CR and 2 of 2 (100%) patients with a CRh* also achieved an MRD complete response (see table 10).
Two patients achieved CR during subsequent cycles, resulting in a cumulative CR rate of 35.6% (16 out of 45; 95% CI: 21.9 – 51.2). Five out of 16 (31.3%) patients underwent allogeneic HSCT in CR/CRh* induced with BLINCYTO.
Table 10. Efficacy results in patients ≥18 years of age with Philadelphia chromosome-positive relapsed or refractory B-cell precursor acute lymphoblastic leukaemia (ALL) (ALCANTARA):
| N=45 | |
|---|---|
| Complete remission (CR)a/Complete remission with partial haematological recovery (CRh*)b, n (%) [95% CI] | 16 (35.6) [21.9, 51.2] |
| CR | 14 (31.1) [18.2, 46.6] |
| CRh* | 2 (4.4) [0.5, 15.1] |
| CRic (without CRh*), n (%) [95% CI] | 2 (4.4) [0.5, 15.1] |
| Blast free hypoplastic or aplastic bone marrow (without CRi)d, n (%) [95% CI] | 3 (6.7) [1.4, 18.3] |
| Partial remissione, n (%) [95% CI] | 2 (4.4) [0.5, 15.1] |
| Complete MRD responsef, n (%) [95% CI] | 18 (40.0) [25.7, 55.7] |
| Median Relapseg-free survival (RFS) for CR/CRh* [95% CI] | 6.7 months [4.4 to NEh] |
| Median Overall survival [95% CI] | 7.1 months [5.6 to NEh] |
a CR was defined as ≤5% of blasts in the bone marrow, no evidence of disease, and full recovery of peripheral blood counts (platelets >100 000/microlitre and absolute neutrophil counts [ANC] >1 000/microlitre).
b CRh* was defined as ≤5% of blasts in the bone marrow, no evidence of disease, and partial recovery of peripheral blood counts (platelets >50 000/microlitre and ANC >500/microlitre).
c CRi (complete remission with incomplete haematologic recovery) was defined as ≤5% blasts in the bone marrow, no evidence of disease, and incomplete recovery of peripheral blood counts (platelets >100 000/microlitre or ANC >1 000/microlitre).
d Blast free hypoplastic or aplastic bone marrow was defined as bone marrow blasts ≤5%, no evidence of disease, insufficient recovery of peripheral counts: platelets ≤50 000/microlitre and/or ANC ≤500/microlitre.
e Partial remission was defined as bone marrow blasts 6% to 25% with at least a 50% reduction from baseline.
f Complete MRD response was defined as the absence of detectable MRD confirmed in an assay with minimum sensitivity of 10-4.
g Relapse was defined as haematological relapse (blasts in bone marrow greater than 5% following CR) or an extramedullary relapse.
h NE = not estimable.
Patients with the higher tumour burden as measured by the percentage of bone marrow blast cells at baseline (≥50%) still had a clinically meaningful response with a CR/CRh* rate of 26.5% (95% CI: 12.9 – 44.4). Patients with low tumour burden (<50%) responded best to BLINCYTO treatment with CR/CRh* rate of 63.6% (95% CI: 30.8 – 89.1). For patients with high peripheral white blood cell counts (≥3.0 × 10⁹/L), response rate was 27.3% (95% CI: 10.7 – 50.2) while percentage of response for those with a lower white blood cell count (<3.0 × 10⁹/L) was 43.5% (95% CI: 23.2 - 65.5).
Treatment effects in evaluable subgroups (e.g. mutation status, number of prior TKIs, prior HSCT status, and relapse without prior HSCT) were in general consistent with the results in the overall population. Patients with T315I mutation, other mutations, or additional cytogenetic abnormalities responded with a similar rate as compared to those that did not have these mutations or abnormalities.
MRD positive B-cell precursor ALL
The safety and efficacy of BLINCYTO in adult patients with MRD positive B-cell precursor ALL were evaluated in an open-label, multicentre, single-arm phase II study (BLAST). Eligible patients were ≥18 years of age with no prior HSCT, had received at least 3 blocks of standard ALL induction therapy, were in complete haematologic remission (defined as <5% blasts in bone marrow, absolute neutrophil count ≥1 000/microlitres, platelets ≥50 000/microlitres, and haemoglobin level ≥9 g/dL) and had molecular failure or molecular relapse (defined as MRD ≥10-3), see table 11. MRD status at screening was determined from bone marrow aspirations using flow cytometry or polymerase chain 25 reaction (PCR) at a minimum sensitivity of 10-4 based on local site evaluations. A central laboratory subsequently confirmed MRD levels by PCR. Final interpretation of MRD results followed EuroMRD Consortium guidelines.
Table 11. Demographics and baseline characteristics in MRD study (BLAST):
| Characteristic | BLINCYTO (N=116) |
|---|---|
| Age | |
| Median, years (min, max) | 45 (18, 76) |
| Mean, years (SD) | 44.6 (16.4) |
| ≥65 years, n (%) | 15 (12.9) |
| Males, n (%) | 68 (58.6) |
| Race, n (%) | |
| Asian | 1 (0.9) |
| Other (mixed) | 1 (0.9) |
| White | 102 (87.9) |
| Unknown | 12 (10.3) |
| Relapse history, n (%) | |
| Patients in 1st CR | 75 (64.7) |
| Patients in 2nd CR | 39 (33.6) |
| Patients in 3rd CR | 2 (1.7) |
| MRD level at baseline*, n (%) | |
| ≥10-1 and <1 | 9 (7.8) |
| ≥10-2 and <10-1 | 45 (38.8) |
| ≥10-3 and <10-2 | 52 (44.8) |
| <10-3 | 3 (2.6) |
| Below lower limit of quantification | 5 (4.3) |
| Unknown | 2 (1.7) |
* Centrally assessed in an assay with minimum sensitivity of 10-4
BLINCYTO was administered as a continuous intravenous infusion. Patients received BLINCYTO at a constant dose of 15 mcg/m²/day (equivalent to the recommended dosage of 28 mcg/day) for all treatment cycles. Patients received up to 4 cycles of treatment. Dose adjustment was possible in case of adverse reactions. The treated population included 116 patients who received at least one infusion of BLINCYTO; the mean number of completed treatment cycles was 1.8 (range: 1 to 4).
The primary endpoint was the proportion of patients who achieved a complete MRD response within one cycle of BLINCYTO treatment. Eighty-eight out of 113 (77.9%) evaluable patients achieved a complete MRD response after one cycle of treatment; see table 12. Two subjects achieved a complete MRD response with 1 additional cycle of BLINCYTO. MRD response rates by age and MRD level at baseline subgroups were consistent with the results in the overall population. RFS in patients with Philadelphia chromosome-negative B-cell precursor ALL at 18 months censored at HSCT or post-BLINCYTO chemotherapy was 54% (33%, 70%). RFS at 18 months not censored at HSCT or post-BLINCYTO chemotherapy was 53% (44%, 62%).
Table 12. Efficacy results in patients ≥18 years of age with MRD positive B-cell precursor ALL (BLAST):
| Complete MRD responsea, n/N (%) , [95% CI] | 88/113b (77.9) [69.1-85.1] |
| ≥65 years old | 12/15 (80.0) [51.9-95.7] |
| Patients in 1st CR | 60/73 (82.2) [71.5-90.2] |
| Patients in 2nd CR | 27/38 (71.1) [54.1-84.6] |
| Patients in 3rd CR | 1/2 (50.0) [1.3-98.7] |
| Duration of complete MRD response [95% CI] | 17.3 months [12.6-23.3] |
a Complete MRD response was defined as the absence of detectable MRD confirmed in an assay with minimum sensitivity of 10-4.
b One hundred thirteen patients (97.4%; 113/116) were included in the primary endpoint full analysis set.
B-cell precursor ALL in the consolidation phase
The efficacy of BLINCYTO in consolidation phase treatment of B-cell precursor ALL in adult and paediatric patients was evaluated in study E1910 and study 20120215. The efficacy results from Study E1910 are described below and the paediatric and young adult studies are described in section paediatric population.
In study E1910 (20129152), the safety and efficacy of BLINCYTO were evaluated in a Phase III, randomised, controlled study in adult patients with newly diagnosed Philadelphia chromosome negative B-cell precursor ALL. Eligible patients received induction chemotherapy. After induction, patients in haematologic complete remission (CR) or CR with incomplete peripheral blood count recovery (CRi) continued on study and received intensification chemotherapy. After intensification therapy, 286 patients were randomised or assigned to receive BLINCYTO alternating with consolidation chemotherapy (n=152) or standard of care (SOC) consolidation chemotherapy alone (n=134). The chemotherapy regimens used in Study E1910 were based on the UKALL12/ECOG2993 protocol. Each arm received maintenance therapy at a total treatment duration of 2.5 years after the start of intensification. Randomisation was stratified by MRD status (MRD negativity defined as <1 × 10⁻⁴), age (<55 years versus ≥55 years), CD20 status, rituximab use, and intent to receive allogeneic stem cell transplant (SCT).
Study treatment in the BLINCYTO arm consisted of 4 cycles of blinatumomab and 4 cycles of chemotherapy in the following sequence. It included 2 cycles of BLINCYTO (each cycle consisted of 28 mcg/day BLINCYTO administered as continuous intravenous infusion for 28 days, with a 14-day treatment-free interval between cycles), followed by 3 cycles of consolidation chemotherapy, a third cycle of BLINCYTO followed by an additional cycle of consolidation chemotherapy, and then a fourth cycle of BLINCYTO. In a posthoc analysis in subjects who did not receive HSCT, numerically greater OS was observed in patients who received 4 cycles vs 1-2 cycles of BLINCYTO in frontline consolidation. Patients received an average of 3.04 cycles of BLINCYTO. If a patient proceeded to allogeneic SCT, it was strongly encouraged that patients randomized to blinatumomab receive both cycles of blinatumomab therapy before proceeding to allogeneic SCT. The SOC arm of the study consisted of 4 cycles of consolidation chemotherapy. Patients in each arm received the same number of cycles and doses of consolidation chemotherapy. Patients who were randomised to the SOC arm could proceed directly to allogeneic SCT or to consolidation chemotherapy.
Baseline demographics and characteristics were similar between the treatment arms. Demographics and characteristics information is provided in table 13.
Table 13. Demographics and characteristics (E1910):
| Characteristic | BLINCYTO arm (N=152) | SOC arma (N=134) | ||
|---|---|---|---|---|
| MRD Positive (N=40) | MRD Negative (N=112) | MRD Positive (N=22) | MRD Negative (N=112) | |
| Age | ||||
| Mean, years (min, max) | 49.6 (30, 69) | 50.2 (30, 70) | ||
| Males, n (%) | 69 (45.4) | 70 (52.2) | ||
| Race, n (%) | ||||
| American Indian or Alaska Native | 2 (1.3) | 1 (0.7) | ||
| Asian | 4 (2.6) | 2 (1.5) | ||
| Black (or African American) | 12 (7.9) | 5 (3.7) | ||
| Hispanic (or Latino) | 21 (13.8) | 15 (11.2) | ||
| Native Hawaiian or Other Pacific Islander | 1 (0.7) | 0 (0.0) | ||
| White | 117 (77.0) | 110 (82.1) | ||
| Received allogeneic SCTb, n (%) | 37 (24.3) | 28 (20.9) | ||
| Mean number of BLINCYTO cycles in patients who received allogeneic SCTb, n (cycles) | 15 (1.93) | 22 (1.95) | ||
| Mean number of BLINCYTO cycles in patients who did not receive allogeneic SCTb, n (cycles) | 21 (2.90) | 89 (3.30) | ||
a SOC = Standard of care.
b allogeneic SCT = allogeneic stem cell transplantation.
The primary endpoint was overall survival (OS) in patients who were MRD-negative. Secondary endpoints included relapse-free survival (RFS) in patients who were MRD-negative, OS and RFS in patients who were MRD-positive.
The study demonstrated improvement in OS and RFS. The stratified hazard ratios and Kaplan-Meier estimates for OS and RFS in patients who were MRD-negative, MRD-positive, and all patients combined regardless of MRD status are provided in table 14. The Kaplan Meier plot for OS in patients who were MRD negative is provided in figure 3. The Kaplan Meier plot for OS in all patients combined regardless of MRD status is provided in figure 4.
Figure 3. Kaplan-Meier for overall survival in patients who were MRD negative at randomisation (prior to start of consolidation) (E1910):
SOC = Standard of Care, KM = Kaplan-Meier, CI = Confidence Interval, N = Number of patients in the analysis set, Censor indicated by vertical bar.
Figure 4. Kaplan-Meier for overall survival combining patients who were MRD-positive and MRD-negative at randomisation (prior to start of consolidation) (E1910):
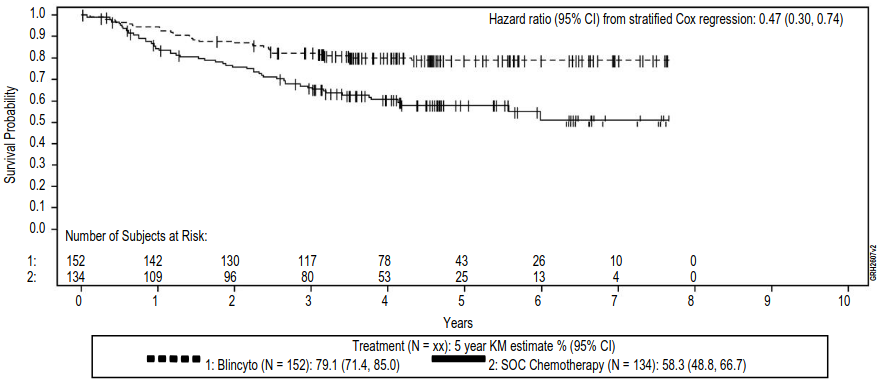
SOC = Standard of Care, KM = Kaplan-Meier, CI = Confidence Interval, N = Number of patients in the analysis set, Censor indicated by vertical bar.
Table 14. Overall survival and relapse-free survival in MRD-negative and MRD-positive patients (E1910):
| BLINCYTO Arm | SOC Arm | |
|---|---|---|
| MRD-Negative | ||
| Number of patients | 112 | 112 |
| Median follow-up time (years)a,b | 4.5 | 4.5 |
| Overall Survival | ||
| 5-year Kaplan-Meier estimate (%) [95% CI] | 82.4 [73.7, 88.4] | 62.5 [52.0, 71.3] |
| Hazard ratio [95% CI]c | 0.44 [0.25, 0.76] | |
| p-value | 0.003 | |
| Relapse-free Survival | ||
| 5-year Kaplan-Meier estimate (%) [95% CI] | 77.0 [67.8, 83.8] | 60.5 [50.1, 69.4] |
| Hazard ratio [95% CI]d | 0.53 [0.32, 0.88] | |
| MRD-Positive | ||
| Number of patients | 40 | 22 |
| Median follow-up time (years)e,b | 4.6 | 5.0 |
| Overall Survival | ||
| 5-year Kaplan-Meier estimate (%) [95% CI] | 70.1 [52.0, 82.5] | 37.8 [17.8, 57.7] |
| Hazard ratio [95% CI]f | 0.40 [0.14, 1.12] | |
| Relapse-free Survival | ||
| 5-year Kaplan-Meier estimate (%) [95% CI] | 71.8 [54.8, 83.3] | 39.4 [19.3, 59.0] |
| Hazard ratio (95% CI)g | 0.37 [0.13, 1.03] | |
| Combined MRD-Negative and MRD-Positive | ||
| Number of patients | 152 | 134 |
| Median follow-up time (years)a,b,e | 4.5 | 4.5 |
| Overall Survival | ||
| 5-year Kaplan-Meier estimate (%) [95% CI] | 79.1 [71.4, 85.0] | 58.3 [48.8, 66.7] |
| Hazard ratio [95% CI]f | 0.47 [0.30, 0.74] | |
| Relapse-free Survival | ||
| 5-year Kaplan-Meier estimate (%) [95% CI] | 75.6 [67.8, 81.8] | 57.2 [47.9, 65.4] |
| Hazard ratio (95% CI)g | 0.53 [0.35, 0.81] | |
Full analysis set includes all randomised or assigned patients who are assessed as MRD-negative or MRD-positive centrally after induction and intensification chemotherapy. CI = Confidence interval. Relapse-free survival (RFS) is calculated from time of randomisation or registration until relapse or death due to any cause. Overall survival (OS) is calculated from time of randomisation or registration until death due to any cause. MRD-positive defined as MRD value ≥1 × 10⁻⁴ and MRD-negative defined as MRD value <1 × 10⁻⁴.
a Years are calculated as days from randomisation date to event/censor date, divided by 365.25.
b Time to censoring measures follow-up time calculated by reversing the status indicator for censored and events.
c The hazard ratio estimates are obtained from a stratified Cox regression model. A hazard ratio <1.0 indicates a lower average death rate and a longer survival for patients in the BLINCYTO arm relative to patients in the SOC arm.
d The hazard ratio estimates are obtained from a stratified Cox regression model. A hazard ratio <1.0 indicates a lower average event rate and a longer relapse-free survival for patients in the BLINCYTO arm relative to patients in the SOC arm.
e Years are calculated as days from randomisation or registration date to event/censor date, divided by 365.25.
f The hazard ratio estimates are obtained from a stratified Cox proportional hazards model. A hazard ratio <1.0 indicates a lower average death rate and a longer survival for patients in the BLINCYTO arm relative to patients in the SOC arm.
g The hazard ratio estimates are obtained from a stratified Cox proportional hazards model. A hazard ratio <1.0 indicates a lower average event rate and a longer relapse-free survival for patients in the BLINCYTO arm relative to patients in the SOC arm.
Paediatric population
The safety and effectiveness of BLINCYTO have been established in paediatric patients with Philadelphia chromosome negative relapsed or refractory B-cell precursor ALL in two open label studies: a single-arm Phase I/II study (MT103-205) and a randomised, controlled Phase III study (20120215).
The safety and efficacy of BLINCYTO compared to standard of care (SOC) consolidation chemotherapy were evaluated in a randomised, controlled, open-label, multicentre study (20120215). Eligible patients were between 28 days and 18 years of age with high-risk first relapsed Philadelphia chromosome-negative B-cell precursor ALL and had <25% blasts in the bone marrow. High-risk patients were defined as per IntReALL criteria. Patients with clinically relevant CNS pathology requiring treatment (e.g. unstable epilepsy) or evidence of current CNS involvement by ALL were excluded from the study. Patients were enrolled and randomised after induction and 2 blocks of consolidation chemotherapy.
Patients were randomised 1:1 to receive BLINCYTO or a third block of SOC consolidation chemotherapy (High-risk consolidation 3, HC3). Patients in the BLINCYTO arm received one cycle of BLINCYTO as a continuous intravenous infusion at 15 mcg/m²/day over 4 weeks (maximum daily dose was not to exceed 28 mcg/day). Dose adjustment was possible in case of adverse reactions. Randomisation was stratified by age (<1 year, 1 to 9 years, and >9 years), bone marrow status determined at the end of the second block of consolidation chemotherapy and MRD status determined at the end of induction (blasts <5% with MRD level <10-3, blasts <5% with MRD level ≥10-3, and blasts ≥5% and <25%). The demographics and baseline characteristics were well-balanced between the two arms (see table 15. No subject had prior HSCT.
Table 15. Demographics and baseline characteristics in study 20120215:
| Characteristics | BLINCYTO (N=54) | SOC Chemotherapy (N=54) |
|---|---|---|
| Age, n (%) | ||
| <1 year | 0 (0.0) | 0 (0.0) |
| 1 to 9 years | 39 (72.2) | 38 (70.4) |
| ≥10 to 18 years | 15 (27.8) | 16 (29.6) |
| Males, n (%) | 30 (55.6) | 22 (40.7) |
| Race, n (%) | ||
| American Indian or Alaska Native | 0 (0.0) | 0 (0.0) |
| Asian | 1 (1.9) | 3 (5.6) |
| Black (or African American) | 0 (0.0) | 3 (5.6) |
| Native Hawaiian or Other Pacific Islander | 0 (0.0) | 0 (0.0) |
| Other | 3 (5.6) | 5 (9.3) |
| White | 50 (92.6) | 43 (79.6) |
| Occurrence and type of any genetic abnormality, n (%) | ||
| No | 34 (63.0) | 29 (53.7) |
| Yes | 20 (37.0) | 25 (46.3) |
| Hyperdiploidy | 6 (11.1) | 6 (11.1) |
| Hypodiploidy | 1 (1.9) | 0 (0.0) |
| t(v;11q23)/MLL rearranged | 0 (0.0) | 4 (7.4) |
| t(12;21)(p13;q22)/TEL-AML1 | 2 (3.7) | 3 (5.6) |
| t(1;19)(q23;p13.3)/E2A-PBX1 | 2 (3.7) | 2 (3.7) |
| t(5;14)(q31;32)/IL3-IGH | 0 (0.0) | 0 (0.0) |
| Other | 9 (16.7) | 10 (18.5) |
| Extramedullary disease at relapse, n (%) | ||
| No | 44 (81.5) | 40 (74.1) |
| Yes | 10 (18.5) | 14 (25.9) |
| Cytomorphology, n (%) | ||
| Blasts <5% | 54 (100.0) | 51 (94.4) |
| Blasts ≥5% and <25% | 0 (0.0) | 2 (3.7) |
| Blasts ≥25% | 0 (0.0) | 0 (0.0) |
| Not evaluable | 0 (0.0) | 1 (1.9) |
| MRD PCR value, n (%) | ||
| ≥10-4 | 10 (18.5) | 13 (24.1) |
| <10-4 | 20 (37.0) | 22 (40.7) |
| Time from first diagnosis to relapse (month), n (%) | ||
| <18 months | 19 (35.2) | 22 (40.7) |
| ≥18 months and ≤30 months | 32 (59.3) | 28 (51.9) |
| >30 months | 3 (5.6) | 4 (7.4) |
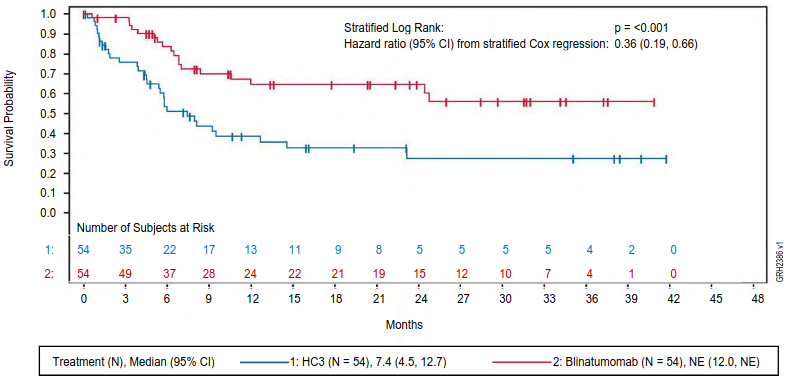
The primary endpoint was event-free survival (EFS). The study demonstrated statistically significant improvement in EFS for patients treated with BLINCYTO as compared to SOC consolidation chemotherapy. Treatment effects in subgroups (e.g. age, tumour burden/MRD status, time from first diagnosis to relapse) were in general consistent with the results in the overall population. See figure 5 and table 16 for primary analysis efficacy results from study 20120215.
Figure 5. Kaplan-Meier curve of event-free survival:
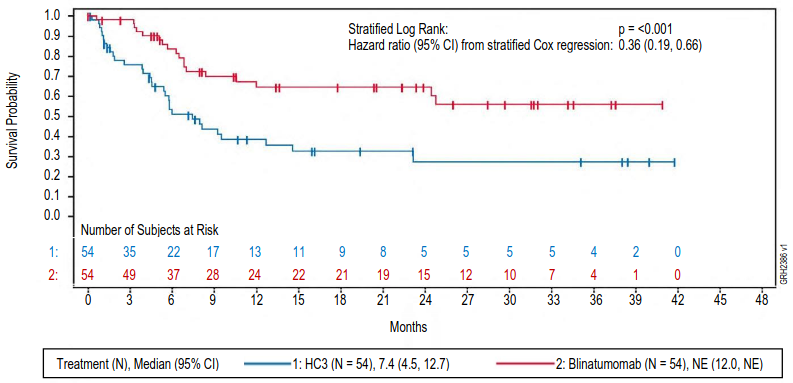
CI = confidence interval, HC3 = High-risk consolidation 3, N = number of patients in the analysis set, NE = not evaluable.
Table 16. Efficacy results in paediatric patients with high-risk first relapsed B-cell precursor ALL (20120215):
| BLINCYTO (N=54) | SOC Chemotherapy (N=54) | |
|---|---|---|
| Event-free survivala | ||
| Events (%) | 18 (33.3) | 31 (57.4) |
| Median, months [95% CI] | NEb [12.0, NEb] | 7.4 [4.5, 12.7] |
| Hazard ratio [95% CI]c | 0.36 [0.19, 0.66] | |
| p-valued | <0.001 | |
| Overall survival | ||
| Number of deaths (%) | 8 (14.8) | 16 (29.6) |
| 36-month estimate (%) [95% CI] | 81.1 [65.5, 90.2] | 55.8 [36.9, 71.0] |
| Hazard ratio [95% CI]c,d | 0.43 [0.18, 1.01] | |
| p-valuee,f | 0.047 | |
| MRD responseg | ||
| Number of MRD response, n1/n2h (%) | 44/49 (89.8) | 26/48 (54.2) |
| [95% CI] | [77.8, 96.6] | [39.2, 68.6] |
| p-valuef,i | <0.001 | |
Note: Efficacy results from primary analysis (data cut-off of 17 July 2019).
a EFS time was calculated from the time of randomisation until the date of relapse or tumour burden of ≥ 5% and <25% blasts after having achieved a complete remission (CR), failure to achieve a CR at the end of treatment, secondary malignancy, or death due to any cause, whichever occurs first.
b NE = not estimable.
c Based on stratified Cox's model.
d The updated hazard ratio for OS (data cut-off of 14 September 2020) was 0.33 (95% CI: 0.15 to 0.72).
e The p-value was derived using a stratified log-rank test.
f Endpoint not formally tested. The p-value was not adjusted for multiplicity.
g MRD (minimum residual disease) response was defined as MRD by PCR <1 × 10⁻⁴.
h n1: number of patients who achieved a MRD response after having a baseline MRD ≥10-4 or <10-4; n2: number of patients assessed.
i The p-value was derived using Cochran Mantel Haenszel test.
The overall median follow-up time for EFS was 51.9 months (95% CI: 47.2, 62.1). In patients who received the SOC consolidation chemotherapy (HC3), the 5-year Kaplan-Meier estimate of EFS, was 27.6% (95% CI: 16.2, 40.3) compared to 57.8% (95% CI: 42.5, 70.4) in patients who received BLINCYTO and the hazard ratio (95% CI) was 0.35 (0.20, 0.61).
The median follow-up time for OS was 55.2 months for the overall population and was similar between treatment arms. The 5-year Kaplan-Meier estimate of OS was 41.4% (95% CI: 26.3 to 55.9) in the chemotherapy (HC3) arm and 78.4% (95% CI: 64.2 to 87.4) in the BLINCYTO arm and the hazard ratio (95% CI) was 0.33 (0.16, 0.66). The median time to transplant was 1.7 months (range: 1 to 4 months) in the HC3 arm and 1.9 months (range: 1 to 3 months) in the BLINCYTO arm.
A numerically higher incidence of postbaseline alloHSCT was reported in the BLINCYTO arm compared with the HC3 arm; 82.5% of subjects (47 of 57) in the HC3 arm and 94.4% of subjects (51 of 54) in the BLINCYTO arm. In the HC3 arm, 39 of 57 subjects (68.4%) received a transplant while in complete remission, whereas, 51 of 54 subjects (94.4%) in the BLINCYTO arm received a transplant while in complete remission.
At time of 100 days post-transplant, the mortality rates reached 3.9% (95% CI: 1.0 to 14.8) in the BLINCYTO arm and 5.1% (95% CI: 1.3 to 19.0) in the chemotherapy (HC3) arm. The Kaplan-Meier median time to death was 1558.0 days in the HC3 arm (95% CI: 431.0 days to NE) and not reached in the blinatumomab arm (95% CI: NE, NE).
The safety and efficacy of BLINCYTO were also evaluated in an open-label, multicentre, single-arm study in 93 paediatric patients with relapsed or refractory B-cell precursor ALL (second or later bone marrow relapse, in any marrow relapse after allogeneic HSCT, or refractory to other treatments, and also with >25% blasts in bone marrow) (MT103-205). This was a two-part study, a dose-finding part to determine the appropriate dosing regimen, followed by a single-arm efficacy part using this regimen.
BLINCYTO was administered as a continuous intravenous infusion. In the dose-finding part of the study, doses of up to 30 mcg/m²/day were evaluated. The recommended dose for the pharmacokinetics (PK) expansion and efficacy parts of the study was determined to be 5 mcg/m²/day on days 1-7 and 15 mcg/m²/day on days 8-28 for cycle 1, and 15 mcg/m²/day on days 1-28 for subsequent cycles. Dose adjustment was possible in case of adverse reactions. Patients who responded to BLINCYTO but later relapsed had the option to be retreated with BLINCYTO.
The treated population (in the dose-finding, PK expansion, and efficacy parts) included 70 patients who received at least 1 infusion of BLINCYTO at the recommended dose; the mean number of treatment cycles was 1.5. Among treated patients, the median age was 8 years (range: 7 months to 17 years), 40 out of 70 (57.1%) had undergone allogeneic HSCT prior to receiving BLINCYTO, and 39 out of 70 (55.7%) had refractory disease. Most patients had a high tumour burden (≥50% leukaemic blasts in bone marrow) at baseline with a median of 75.5% bone marrow blasts.
Twenty out of 70 (28.6%) patients achieved CR/CRh* within the first 2 treatment cycles with 17 out of 20 (85%) occurring within cycle 1 of treatment. Four patients achieved M1 bone marrow but did not meet the peripheral blood count recovery criteria for CR or CRh*. Eleven of the 20 patients (55%) who achieved CR/CRh* received an allogeneic HSCT. The CR/CRh* for patients less than 2 years of age was 40.0% (4/10), for patients 2 to 6 years was 30.0% (6/20); and for patients aged 7 to 17 years was 25.0% (10/40). Three patients <1 year of age refractory to prior treatment and without prior alloHSCT received one cycle of BLINCYTO at a dose of 5-15 mcg/m²/day. None of the 3 subjects <1 year old achieved a CR/CRh*, 1 patient had progressive disease (OS 2.3 months) and 2 were non-responders (OS 1.1 months and 8.7 months, respectively). The type of adverse reactions observed in infants were similar to those observed in the overall paediatric population. See table 17 for the efficacy results.
Table 17. Efficacy results in patients <18 years of age with relapsed or refractory B-cell precursor ALL (MT103-205):
| N=70 | |
|---|---|
| CRa/CRh*b, n (%) [95% CI] | 20 (28.6%) [18.4% – 40.6%] |
| CR, n (%) [95% CI] | 11 (15.7%) [8.1% – 26.4%] |
| CRh*, n (%) [95% CI] | 9 (12.9%) [6.1% – 23.0%] |
| Complete MRD response for CR/CRh*c, n1/n2d (%) [95% CI] | 11/20 (55.0%) [31.5 – 76.9] |
| CR, n1/n2d (%) [95% CI] | 6/11 (54.5%) [23.4 – 83.3] |
| CRh*, n1/n2d (%) [95% CI] | 5/9 (55.6%) [21.2 – 86.3] |
| Median relapsee-free survival (RFS)e for CR/CRh* [95% CI] | 6.8 months [2.2 to 12.0 months] |
| Median overall survival [95% CI] | 7.5 months [4.0 to 11.8 months] |
| 100-day mortality after alloHSCTf | |
| n/N (%) , [95% CI] | 1/6 (16.7%) [2.5% – 72.7%] |
a CR was defined as M1 marrow (≤5% of blasts in the bone marrow), no evidence of circulating blasts or extramedullary disease, and full recovery of peripheral blood counts (platelets >100 000/microlitre and absolute neutrophil counts [ANC] >1 000/microlitre) and no relapse within 28 days.
b CRh* was defined as M1 marrow (≤5% of blasts in the bone marrow), no evidence of circulating blasts or extramedullary disease, and partial recovery of peripheral blood counts (platelets >50 000/microlitre and ANC >500/microlitre) and no relapse within 28 days.
c Complete MRD response No detectable signal for leukaemic cells either by PCR or flow cytometry.
d n1: number of patients who achieved MRD response and the respective remission status; n2: number of patients who achieved the respective remission status. One CR /CRh* responder with missing MRD data was considered as a MRD-nonresponder.
e Relapse was defined as haematological relapse (blasts in bone marrow greater than 25% following CR) or an extramedullary relapse.
f Only patients with HSCT in CR/CRh* remission (with no anti-leukaemia agents used prior to HSCT) are included.
5.2. Pharmacokinetic properties
The pharmacokinetics of blinatumomab appear linear over a dose range from 5 to 90 mcg/m²/day (approximately equivalent to 9-162 mcg/day) in adult patients. Following continuous intravenous infusion, the steady state serum concentration (Css) was achieved within a day and remained stable over time. The increase in mean Css values was approximately proportional to the dose in the range tested. At the clinical doses of 9 mcg/day and 28 mcg/day for the treatment of relapsed or refractory ALL, the mean (SD) Css was 228 (356) pg/mL and 616 (537) pg/mL, respectively. The pharmacokinetics of blinatumomab in patients with MRD positive B-cell precursor ALL were similar to patients with relapsed or refractory ALL. The pharmacokinetics of blinatumomab in the consolidation phase in adults with B-cell precursor ALL, including patients with newly diagnosed ALL and first relapsed ALL, were similar to adult patients with relapsed or refractory ALL.
Distribution
The estimated mean (SD) volume of distribution based on terminal phase (Vz) was 5.27 (4.37) L with the continuous intravenous infusion of blinatumomab.
Biotransformation
The metabolic pathway of blinatumomab has not been characterised. Like other protein therapeutics, blinatumomab is expected to be degraded into small peptides and amino acids via catabolic pathways.
Elimination
The estimated mean (SD) systemic clearance with continuous intravenous infusion in patients receiving blinatumomab in clinical studies was 3.10 (2.94) L/hour. The mean (SD) half-life was 2.20 (1.34) hours. Negligible amounts of blinatumomab were excreted in the urine at the tested clinical doses.
Specific Populations
No clinically meaningful differences in the pharmacokinetics of blinatumomab were observed based on age, sex, race, ethnicity, Philadelphia chromosome status, or mild (total bilirubin ≤ upper limit of normal [ULN] and AST > ULN or total bilirubin > 1 to 1.5 × ULN and any AST) or moderate hepatic impairment (total bilirubin > 1.5 to 3 × ULN and any AST). Body surface area (0.4 to 2.9 m²) influences the pharmacokinetics of blinatumomab, supporting BSA-based dosing in patients < 45 kg.
Renal impairment
No formal pharmacokinetic studies of blinatumomab have been conducted in patients with renal impairment.
Pharmacokinetic analyses showed an approximately 2-fold difference in mean blinatumomab clearance values between patients with moderate renal dysfunction and normal renal function. However since high inter-patient variability was discerned (CV% up to 98.4%), and clearance values in renal impaired patients were essentially within the range observed in patients with normal renal function, no clinically meaningful impact of renal function on clinical outcomes is expected. The effect of severe renal impairment on the pharmacokinetics of blinatumomab has not been studied.
Hepatic impairment
No formal pharmacokinetic studies using blinatumomab have been conducted in patients with hepatic impairment. The effect of hepatic impairment on the clearance of blinatumomab was evaluated by population pharmacokinetic analysis in patients with mild and moderate hepatic dysfunction compared to normal hepatic function using the criteria defined by the National Cancer Institute Organ Dysfunction Working Group. No clinically meaningful differences in the clearance of blinatumomab were observed between patients with mild and moderate hepatic dysfunction and patients with normal function. The effect of severe hepatic impairment on the pharmacokinetics of blinatumomab has not been studied.
Paediatric population
The pharmacokinetics of blinatumomab appear linear over a dose range from 5 to 30 mcg/m²/day in paediatric patients. At the recommended doses of 5 and 15 mcg/m²/day for the treatment of relapsed or refractory B-cell precursor ALL, the mean (SD) steady state concentration (Css) values were 162 (179) and 533 (392) pg/mL, respectively. The estimated mean (SD) volume of distribution (Vz), clearance (CL) and terminal half-life (t1/2,z) were 4.14 (3.32) L/m², 1.65 (1.62) L/hr/m² and 2.14 (1.44) hours, respectively.
The pharmacokinetics of blinatumomab in the consolidation phase in paediatric patients with B-cell precursor ALL, including patients with first relapsed B-cell precursor ALL, were similar to paediatric patients with relapsed or refractory B-cell precursor ALL.
5.3. Preclinical safety data
Repeat-dose toxicity studies conducted with blinatumomab and the murine surrogate revealed the expected pharmacologic effects (including release of cytokines, decreases in leukocyte counts, depletion of B-cells, decreases in T-cells, decreased cellularity in lymphoid tissues). These changes reversed after cessation of treatment.
Reproductive toxicity studies have not been conducted with blinatumomab. In an embryo-foetal developmental toxicity study performed in mice, the murine surrogate crossed the placenta to a limited extent (foetal-to-maternal serum concentration ratio <1%) and did not induce embryo-foetal toxicity or teratogenicity. The expected depletions of B- and T-cells were observed in the pregnant mice but haematological effects were not assessed in foetuses. No studies have been conducted to evaluate treatment-related effects on fertility. There were no effects on male or female reproductive organs in toxicity studies with the murine surrogate.
© All content on this website, including data entry, data processing, decision support tools, "RxReasoner" logo and graphics, is the intellectual property of RxReasoner and is protected by copyright laws. Unauthorized reproduction or distribution of any part of this content without explicit written permission from RxReasoner is strictly prohibited. Any third-party content used on this site is acknowledged and utilized under fair use principles.