BRUKINSA Hard capsule Ref.[110578] Active ingredients: Zanubrutinib
Source: European Medicines Agency (EU) Revision Year: 2024 Publisher: BeiGene Ireland Limited., 10 Earlsfort Terrace, Dublin 2, D02 T380, Ireland, Tel. +353 1 566 7660, E-mail bg.ireland@beigene.com
5.1. Pharmacodynamic properties
Pharmacotherapeutic group: Antineoplastic agents, Bruton's tyrosine kinase inhibitors
ATC code: L01EL03
Mechanism of action
Zanubrutinib is an inhibitor of Bruton's tyrosine kinase (BTK). Zanubrutinib forms a covalent bond with a cysteine residue in the BTK active site, leading to inhibition of BTK activity. BTK is a signalling molecule of the B-cell antigen receptor (BCR) and cytokine receptor pathways. In B-cells, BTK signalling results in activation of pathways necessary for B-cell proliferation, trafficking, chemotaxis, and adhesion.
Pharmacodynamic effects
BTK occupancy in PBMCs and lymph node biopsies
The median steady-state BTK occupancy in peripheral blood mononuclear cells was maintained at 100% over 24 hours at a total daily dose of 320 mg in patients with B-cell malignancies. The median steady-state BTK occupancy in lymph nodes was 94% to 100% following the recommended dose.
Effect on QT/QTc interval and cardiac electrophysiology
At the recommended doses (320 mg once daily or 160 mg twice daily), there were no clinically relevant effects on the QTc interval. At a single dose 1.5 times the maximum recommended dose (480 mg), zanubrutinib did not prolong the QT interval to any clinically relevant extent (i.e., ≥10 msec).
Clinical efficacy and safety
Patients with Waldenström Macroglobulinemia (WM)
The safety and efficacy of BRUKINSA in WM were evaluated in a randomized, open-label, multicentre study comparing zanubrutinib and ibrutinib (ASPEN study, BGB-3111-302) in patients who were BTK inhibitor naive. Eligible patients were at least 18 years of age with a clinical and definite histological diagnosis of relapsed/refractory WM or treatment-naïve when considered unsuitable for standard chemo-immunotherapy regimens by their treating physician. Patients had to meet at least one criterion for treatment according to consensus panel criteria from the Seventh International Workshop on Waldenström's Macroglobulinemia (IWWM) and have measurable disease, as defined by a serum IgM level >0.5 g/dl. Patients with MYD88 mutation (MYD88MUT) were assigned to Cohort 1 (N=201) and were randomized 1:1 to receive either zanubrutinib 160 mg twice daily (Arm A) or ibrutinib 420 mg once daily (Arm B) until disease progression or unacceptable toxicity. Subjects found to have MYD88 wildtype (MYD88WT) by gene sequencing (estimated to be present in approximately 10% of enrolled subjects), were enrolled to Cohort 2 (N=28) and received zanubrutinib 160 mg twice daily on a third, non-randomized, study arm (Arm C).
In Cohort 1 (MYD88MUT), the median age was 70 years (range, 38 to 90 years), with 71% and 60% of patients treated with ibrutinib and zanubrutinib respectively being >65 years old. 33% of patients in the zanubrutinib arm and 22% in the ibrutinib were >75 years. 67% were male, and 91% were Caucasian. At study entry, 44% of patients in the ibrutinib arm and 46% of patients in the zanubrutinib arm had an International Prognostic Scoring System (IPSS) high. One hundred and sixty-four patients had relapsed or refractory disease; the median number of prior therapies was 1 (range, 1 to 8).
The primary outcome measure was rate of Complete Response (CR) or Very Good Partial Response (VGPR), as assessed by an independent review committee (IRC) with adaptation of the response criteria updated at the Sixth IWWM. The secondary endpoints for Cohort 1 include major response rate (MRR), duration of response, rate of CR or VGPR determined by investigator, and progressionfree survival (PFS).
The testing for the superiority of the primary endpoint of VGPR or CR rate required testing in the Relapsed/Refractory Analysis Set prior to testing in the ITT Analysis Set. Median follow-up was 19.4 months. In the relapsed/refractory patients, 19.8% and 28.9% achieved VGPR or CR on the ibrutinib and zanubrutinib arms, respectively. The primary efficacy endpoint was not significant in the Relapsed/Refractory Analysis Set (2-sided p=0.1160). Table 5 summarizes the responses as assessed by IRC for the Relapsed/Refractory and intent-to-treat (ITT) Analysis Set. Responses were observed with zanubrutinib across subgroups, including MYD88WT patients (Cohort 2) who had a VGPR or CR rate of 26.9% and an MRR of 50%.
Table 5. Primary analysis of disease response by independent review committee (ASPEN Study):
| Response Category | Relapsed/Refractory | ITT | ||
|---|---|---|---|---|
| Ibrutinib N=81 | Zanubrutinib N=83 | Ibrutinib N=99 | Zanubrutinib N=102 | |
| Median follow-up time, months (range) | 18.79 (0.5, 30.0) | 18.73 (0.4, 28.7) | 19.38 (0.5, 31.1) | 19.47 (0.4, 31.2) |
| CR | 0 (0.0) | 0 (0.0) | 0 (0.0) | 0 (0.0) |
| VGPR | 16 (19.8) | 24 (28.9) | 19 (19.2) | 29 (28.4) |
| PR | 49 (60.5) | 41 (49.4) | 58 (58.6) | 50 (49.0) |
| VGPR or CR rate, n (%) | 16 (19.8) | 24 (28.9) | 19 (19.2) | 29 (28.4) |
| 95% CIa | (11.7, 30.1) | (19.5, 39.9) | (12.0, 28.3) | (19.9, 38.2) |
| Risk difference (%)b | 10.7 | 10.2 | ||
| 95% CIa | (-2.5, 23.9) | (-1.5, 22.0) | ||
| p-valuec | 0.1160 | |||
| MRR (PR or better), n (%) | 65 (80.2) | 65 (78.3) | 77 (77.8) | 79 (77.5) |
| 95% CIa | (69.9, 88.3) | (67.9, 86.6) | (68.3, 85.5) | (68.1, 85.1) |
| Risk difference (%)b | -3.5 | -0.5 | ||
| 95% CI | (-16.0, 9.0) | (-12.2, 11.1) | ||
| Duration of major response | ||||
| Event-free rate at, % (95% CI)d 18 months | 85.6 (73.1, 92.6) | 87.0 (72.5, 94.1) | 87.9 (77.0, 93.8) | 85.2 (71.7, 92.6) |
Percentages are based on N.
a 2-sided Clopper-Pearson 95% confidence interval.
b Mantel-Haenszel common risk difference with the 95% confidence interval calculated using a normal approximation and Sato's standard error stratified by the stratification factors per IRT (strata CXCR4 WT and UNK are combined) and age group (≤65 and >65). Ibrutinib is the reference group.
c Based on CMH test stratified by the stratification factors per IRT (strata CXCR4 WT and UNK are combined) and age group (≤65 and >65)
d Event-free rates are estimated by Kaplan-Meier method with 95% CIs estimated using the Greenwood's formula.
Based on an updated data cut-off the progression free-survival event-free rate by investigator assessment was 77.6% vs 84.9% at 30 months (ibrutinib vs zanubrutinib), with an estimated overall hazard ratio of 0.734 (95% CI: 0.380, 1.415).
Patients with Marginal Zone Lymphoma (MZL)
The efficacy of zanubrutinib was assessed in a Phase 2 open-label, multicentre, single-arm trial of 68 patients with MZL who had received at least one prior anti-CD20-based therapy (MAGNOLIA study, BGB-3111-214). Twenty-six (38.2%) patients had extranodal MZL, 26 (38.2%) had nodal MZL, 12 (17.6%) had splenic MZL, and in 4 (6%) patients, the subtype was unknown. Zanubrutinib was given orally at a dose of 160 mg twice daily until disease progression or unacceptable toxicity. The median age of patients was 70 years (range: 37 to 95), and 53% were male. The median time since initial diagnosis was 61.5 months (range: 2.0 to 353.6). The median number of prior treatments was 2 (range: 1 to 6), with 27.9 % patients having 3 or more lines of systemic therapy; 98.5% (n=67) patients had received prior rituximab-based chemotherapy and 85.3% (n=58) patients had received prior treatment with alkylating agents; 5.9% patients (n=4) had prior stem cell transplantation. Sixtythree (92.6%) patients had a baseline ECOG performance status of 0 or 1. Twenty-two (32.4%) patients had refractory disease at study entry.
Tumor response was according to the 2014 Lugano Classification, and the primary efficacy endpoint was overall response rate as assessed by an Independent Review Committee (IRC) (Table 6).
Table 6. Efficacy Results in Patients with MZL by Independent Review Committee (MAGNOLIA study):
| Study BGB-3111-214 (N=66)a | |
|---|---|
| ORR (95% CI) | 68% (55.6,79.1) |
| CR | 26% |
| PR | 42% |
| Median DoR in months (95% CI) | NE (25.0, NE) |
| DOR Event Free Rate b at 24 months, % (95% CI) | 72.9 (54.4, 84.9) |
| Median study follow-up in months (Min, Max) | 28.04 (1.64, 32.89) |
a Two patients in BGB-3111-214 were not evaluable for efficacy due to central confirmation of MZL transformation to diffuse large B-cell lymphoma.
b Event free rates were estimated by Kaplan-Meier method with 95% CIs estimated using the Greenwood's formula.
ORR: overall response rate, CR: complete response, PR: partial response, DoR: duration of response, CI: confidence interval, NE: not estimable
In BGB-3111-214, the median time to response was 2.79 months (range: 1.7 to 11.1 months). After a median study follow-up time of 28.04 months (range: 1.64 to 32.89 months), the median duration of response (DOR) as assessed by the IRC has not been reached (95% CI 25.0 months to NE), and a total of 72.9% (95% CI 54.4 to 84.9) of responders were estimated to be event-free at 24 months after initial response.
The overall response rates observed were similar across three different MZL subtypes (extranodal, nodal and splenic).
Patients with Chronic Lymphocytic Leukaemia (CLL)
The efficacy of BRUKINSA in patients with CLL was evaluated in two randomized controlled trials.
SEQUOIA study (BGB-3111-304): An International, Phase 3, Open-label, Randomized Study of Zanubrutinib Compared with Bendamustine plus Rituximab (BR) in Patients with Previously Untreated CLL
The SEQUOIA study (BGB-3111-304) is a randomized multicenter, open-label, active controlled Phase 3 trial of zanubrutinib monotherapy and bendamustine in combination with rituximab in 479 patients with previously untreated CLL without 17p deletion (del(17p)) (arms A and B; Cohort 1). Arm C (Cohort 2) is a multicenter single-arm trial of zanubrutinib monotherapy in 110 patients with previously untreated CLL with centrally confirmed del(17p).
Both Cohorts enrolled patients 65 years of age or older as well as patients between 18 and 65 years of age that were unsuitable for chemoimmunotherapy with fludarabine, cyclophosphamide and rituximab (FCR).
Demographic and baseline characteristics were generally balanced between arm A (zanubrutinib) and arm B (BR) of Cohort 1. In both arms, the median age was 70.0 years, with a slightly higher proportion of patients of ≥75 years (26.1%) in arm A compared with arm B (22.3%) and a slightly lower proportion of patients 65-75 years old (55.2%) in arm A compared with arm B (58.4%). In Cohort 1, 92.7% patients had a baseline ECOG performance status of 0 or 1 (93.7% in arm A and 91.6% in arm B). In Cohort 2 (arm C zanubrutinib), 87.3% patients had a baseline ECOG performance status of 0 or 1.
Demographic and baseline characteristics were also generally similar between arm A (zanubrutinib) in Cohort 1 and arm C (zanubrutinib) in Cohort 2.
In Cohort 1, randomisation was stratified by age (<65 years vs ≥65 years), Binet stage (C versus A or B), immunoglobulin variable region heavy chain (IGHV) mutational status (mutated vs unmutated), and geographic region (North America versus Europe versus Asia Pacific). A total of 479 patients were randomized (intent-to-treat [ITT] analysis set), 241 to zanubrutinib continuous monotherapy and 238 to 6 cycles of therapy with bendamustine and rituximab (BR).
In Cohort 1, patients in the zanubrutinib arm A received 160 mg twice daily until disease progression or unacceptable toxicity. In arm B, patients received bendamustine at a dose of 90 mg/m²/day on the first 2 days of each cycle for 6 cycles and rituximab at a dose of 375 mg/m² for Cycle 1, and at a dose of 500 mg/m² for Cycles 2 to 6. Each treatment cycle consisted of approximately 28 days. In Cohort 2 (arm C), patients received zanubrutinib 160 mg twice daily until disease progression or unacceptable toxicity.
For Cohort 1, the primary endpoint was progression-free survival (PFS), assessed by an independent central review committee (IRC). Secondary endpoints included the overall response rate based on IRC assessment.
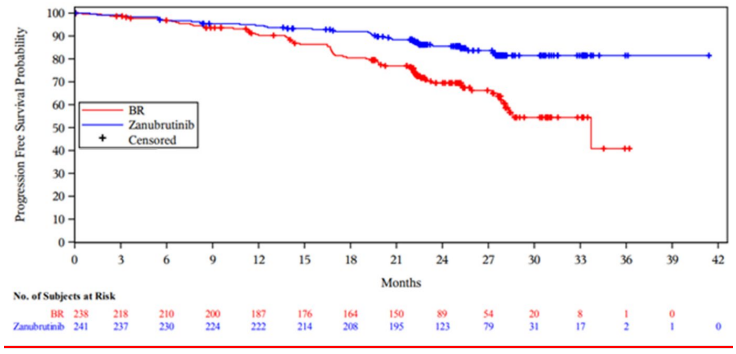
In Cohort 1, the median duration of follow-up for PFS was 25.0 months (range: 0.0 to 41.4). The PFS rate at 24 months was 85.5% (95% CI: 80.1, 89.6) for zanubrutinib and 69.5% (95% CI: 62.4, 75.5) for BR. In Cohort 2, the median duration of follow up for PFS was 27.9 months (range: 1.0 to 38.8) and the PFS rate at 24 months 88.9% (95% CI: 81.3, 93.6). The ORR assessed by IRC in Cohort 2 was 90.0% (95% CI: 82.8, 94.9). The median time to partial response or higher as assessed by IRC was 2.89 months (range: 1.8, 14.2) and 2.86 months (range: 1.9, 13.9) in the zanubrutinib arm of Cohort 1 and Cohort 2, respectively.
Efficacy results for cohort 1 is presented in Table 7. The Kaplan-Meier curves for PFS for both arms in Cohort 1 are shown in Figure 1.
Table 7. Efficacy Results in the SEQUOIA study:
| Cohort 1* Patients without Del(17p) | ||
|---|---|---|
| Endpoint | Zanubrutinib (N=241) | Bendamustine + Rituximab (N=238) |
| Progression-Free Survival† | ||
| Number of Events, n (%) | 36 (14.9) | 71 (29.8) |
| Disease Progression, n (%) | 27 (11.2) | 59 (24.8) |
| Death, n (%) | 9 (3.7) | 12 (5.0) |
| Median (95% CI), monthsa | NE (NE, NE) | 33.7 (28.1, NE) |
| Hazard Ratio (95% CI)b | 0.42 (0.28, 0.63) | |
| P valuec | <0.0001 | |
| Overall Response Rate† % (95% CI) | 94.6% (91.0, 97.1) | 85.3% (80.1, 89.5) |
Overall Response Rate: CR+CRi+nPR+PR+PR-L, CR: complete response, CRi: complete response with incomplete haematopoietic recovery, nPR: nodular partial response, PR: partial response, PR-L: partial response with lymphocytoma, CI: confidence interval, NE: not estimable, median follow-up time for PFS was 25.0 months (95% CI: 24.6, 25.2).
* ITT analysis set
† Assessed by independent central review committee.
a Based on Kaplan-Meier estimation.
b Based on a stratified Cox-regression model with bendamustine + rituximab as the reference group.
c Based on a stratified log-rank test.
At an updated ad hoc analysis with a median follow-up of 33.5 months for PFS, the investigatorassessed PFS remained consistent with the primary analysis with a HR of 0.33 (95% CI: 0.22 to 0.48, descriptive P<0.0001) in the zanubrutinib arm over the BR arm. Median PFS was not reached with zanubrutinib arm and was 39.2 months for BR arm. At 36 months after randomization, 83.6% of patients treated with zanubrutinib and 55.1% with BR were estimated to be progression-free and alive. With a median follow-up of 35.8 months, the median OS was not reached for both arms; the 36-month OS rate estimate was 90.9% (95% CI: 86.3 to 94.0) in the zanubrutinib arm and 89.5% (95% CI: 84.2 to 93,1) in the BR arm, respectively.
Figure 1. Kaplan-Meier Curve of IRC-assessed PFS in the SEQUOIA study Cohort 1 (ITT population):
ALPINE study (BGB-3111-305): A Phase 3, Randomized Study of Zanubrutinib Compared with Ibrutinib in Patients with Relapsed/Refractory (R/R) CLL
The ALPINE study (BGB-3111-305) is a randomized, multicenter, open-label, Phase 3, active controlled trial. It enrolled 652 patients with relapsed or refractory CLL after at least one prior systemic therapy. The patients were randomized to either zanubrutinib 160 mg orally twice daily or ibrutinib 420 mg orally once daily, continued until disease progression or unacceptable toxicity.
Randomization was stratified by age (<65 years versus ≥65 years), geographic region (China versus non-China), refractory status (yes or no), and del(17p)/TP53 mutation status (present or absent).
Baseline demographics and disease characteristics were generally balanced between treatment arms in ITT analysis set and in the first 415 randomized patients.
In the ITT analysis set, the median age was 67.0 years in the zanubrutinib arm and 68.0 years in the ibrutinib arm. The majority of patients in both arms had an ECOG PS of 0 or 1 (97.9% in the zanubrutinib arm; 96.0% in the ibrutinib arm). Similar demographics and baseline characteristics were observed in the first 415 randomized patients. The median number of prior lines of systemic therapy is 1.0 the zanubrutinib arm (range, 1 to 6) and 1.0 in the ibrutinib arm (range, 1 to 8) in both the ITT analysis set and the first 415 randomized patients.
Patients previously treated with a BTK inhibitor were excluded from study 305 and limited data for zanubrutinib after prior BCL 2 inhibitor treatment is available.
Of 652 patients total, 327 were assigned to zanubrutinib monotherapy, 325 to ibrutinib monotherapy. The efficacy evaluation is based on the pre-specified interim analysis of the first 415 randomized patients of the ITT population. Of these, 207 were randomized to zanubrutinib monotherapy, 208 to ibrutinib monotherapy. Efficacy results are presented in Table 8.
The primary endpoint was overall response rate (ORR, defined as partial response or better).
At the pre-specified ORR interim analysis in the first 415 randomised patients, zanubrutinib demonstrated non-inferiority (1-sided p <0.0001) and superiority (2-sided p=0.0006) to ibrutinib in the protocol-specified primary endpoint ORR assessed by investigator. Response as determined by IRC also demonstrated non-inferiority of zanubrutinib to ibrutinib (1-sided p<0.0001). At the ORR final analysis, ORR assessed by the investigator continues to be higher (79.5% versus 71.1%) in the zanubrutinib arm compared with the ibrutinib arm (descriptive p=0.0133); ORR determined by IRC was also significantly higher in the zanubrutinib arm compared with the ibrutinib arm, demonstrating superiority (80.4% versus 72.9%, respectively; 2-sided p=0.0264).
Table 8. Efficacy Results in the ALPINE study (Pre-specified Interim Analysis of the First 415 randomized Patients) by Investigator (protocol defined primary endpoint) and IRC Assessment:
| Investigator Assessed (protocol-define primary endpoint) | IRC Assessed | |||
|---|---|---|---|---|
| Endpoint | Zanubrutinib (N=207) | Ibrutinib (N=208) | Zanubrutinib (N=207) | Ibrutinib (N=208) |
| Overall Response Rate§ n (%) | 162 (78.3) | 130 (62.5) | 158 (76.3) | 134 (64.4) |
| (95% CI) | (72.0, 83.7) | (55.5, 69.1) | (69.9, 81.9) | (57.5, 70.9) |
| Response ratioa (95% CI) | 1.25 (1.10, 1.41) | 1.17 (1.04, 1.33) | ||
| Non-inferiorityb | 1-sided p-value <0.0001 | 1-sided p-value <0.0001 | ||
| Superiorityc | 2-sided p-value 0.0006 | 2-sided p-value 0.0121 | ||
| Duration of Responsed: 12-months event-free rate % (95% CI) | 89.8 (78.1, 95.4) | 77.9 (64.7, 86.7) | 90.3 (82.3, 94.8) | 78.0 (66.1, 86.2) |
Overall Response Rate : CR + CRi + nPR + PR, CR: complete response, CRi: complete response with incomplete haematopoietic recovery, nPR: nodular partial response, PR: partial response, CI: confidence interval
Median duration of response as assessed by investigator was not reached in the zanubrutinib arm at interim analysis, median study follow-up time was 15.31 months (range: 0.1, 23.1) in zanubrutinib arm and 15.43 months (range: 0.1, 26.0) in ibrutinib arm.
§ Hypothesis testing for the noninferiority of ORR at the interim analysis is based on the first 415 randomized patients only with
a 1-sided significance level of 0.005. a Response ratio: estimated ratio of the overall response rate in the zanubrutinib arm divided by that in the ibrutinib arm.
b Stratified test against a null response ratio of 0.8558.
c Stratified Cochran-Mantel-Haenszel test.
d Kaplan-Meier estimate.
The median time to response as assessed by the investigator at the ORR interim analysis in first 415 randomised patients was 5.59 months (range: 2.7, 14.1) in zanubrutinib arm and 5.65 months (range: 2.8, 16.7) in ibrutinib arm. The results assessed by IRC were consistent (5.55 months vs. 5.63 months in zanubrutinib and ibrutinib arms respectively). At the ORR final analysis in all 652 randomised patients, the median time to response remained unchanged (5.59 months vs. 5.65 months as assessed by investigator and 5.52 months vs. 5.62 months as assessed by IRC in zanubrutinib and ibrutinib arms respectively).
In patients with del(17p) mutation in the first 415 randomized patients, the ORR assessed by investigator were 83.3% (95% CI 62.5, 95.3; 20 of 24 patients) in the zanubrutinib arm and 53.8% (95% CI 33.4, 73.4; 14 of 26 patients) in the ibrutinib arm. Based on IRC assessment, the ORR were 79.2% (95% CI 57.8, 92.9; 19 of 24 patients) in the zanubrutinib arm and 61.5% (95% CI 40.6, 79.8; 16 of 26 patients) in the ibrutinib arm. At the ORR final analysis in all 652 randomized patients, the ORR assessed by investigator were 86.7% (95% CI 73.2, 94.9; 39 of 45 patients with del(17p) mutation) in the zanubrutinib arm and 56.0% (95% CI 41.3, 70.0; 28 of 50 patients with del(17p) mutation) in the ibrutinib arm. Based on IRC assessment, the ORR were 86.7% (95% CI 73.2, 94.9; 39 of 45 patients with del(17p) mutation) in the zanubrutinib arm and 64.0% (95% CI 49.2, 77.1; 32 of 50 patients with del(17p) mutation) in the ibrutinib arm.
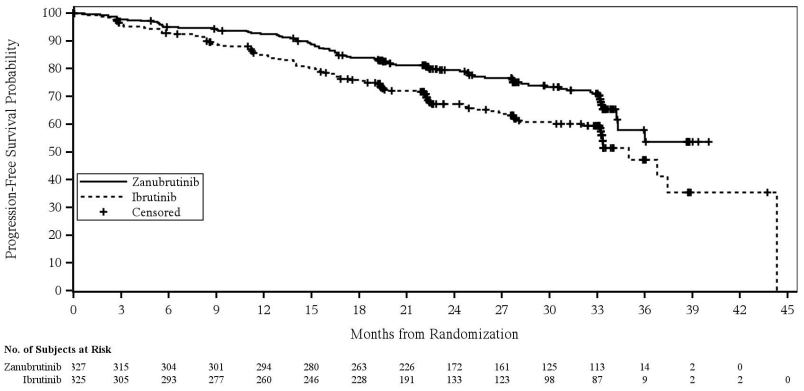
A total of 652 patients were enrolled at the prespecified time of final PFS analysis (cut-off date 8 August 2022). The median PFS follow-up time was 28.1 months as assessed by investigator and 30.7 months as assessed by IRC Zanubrutinib showed superiority in PFS over ibrutinib as assessed by both investigator and IRC. The efficacy results for PFS are presented in Table 9, and a Kaplan Meier Plot as assessed by IRC is provided in Figure 2.
Table 9. Efficacy Results in the ALPINE study (prespecified final PFS analysis of all 652 randomized patients) by Investigator and IRC assessment (cut-off date 8 August 2022):
| Endpoint | Investigator Assessed | Independently Assessed | ||
|---|---|---|---|---|
| Zanubrutinib (N=327) | Ibrutinib (N=325) | Zanubrutinib (N=327) | Ibrutinib (N=325) | |
| Progression-Free Survival | ||||
| Events, n (%) | 87 (26.6) | 118 (36.3) | 88 (26.9) | 120 (36.9) |
| Hazard Ratioa (95% CI) | 0.65 (0.49, 0.86) | 0.65 (0.49, 0.86) | ||
| 2-sided p-valueb | 0.0024 | 0.0024 | ||
a Based on a stratified Cox-regression model with ibrutinib as the reference group.
b Based on a stratified log-rank test.
Figure 2. Kaplan-Meier Plot of Progression-Free Survival by Independent Central Review (ITT) (cut-off date 8 August 2022):
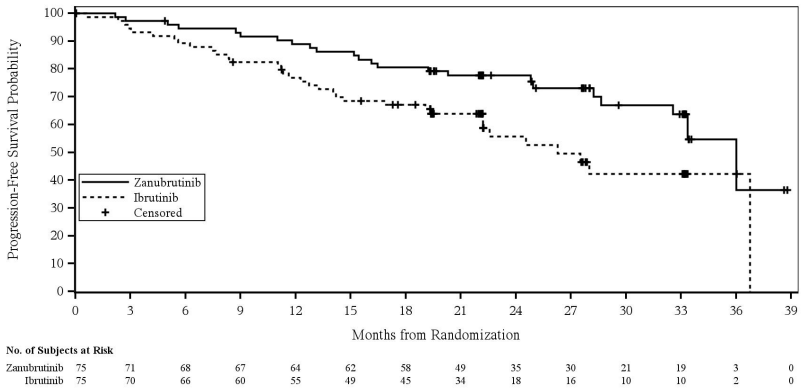
In patients with del(17p)/TP53 mutation, the hazard ratio for progression-free survival by investigator assessment was 0.53 (95% CI 0.31, 0.88). Based on independent review, the hazard ratio was 0.52 (95% CI 0.30, 0.88) (Figure 3).
Figure 3. Kaplan-Meier Plot of Progression-Free Survival by Independent Central Review for Patients with Del 17P or TP53 (ITT) (cut-off date 8 August 2022):
With an estimated median follow-up of 32.8 months, the median overall survival was not reached in either arm with 17% of patients experiencing an event.
Patients with Follicular Lymphoma (FL)
The efficacy of zanubrutinib in combination with obinutuzumab versus obinutuzumab was assessed in the ROSEWOOD study (BGB-3111-212), a phase 2 randomized, open-label, multicentre study. Overall, 217 patients with relapsed (defined by disease progression after completion of the most recent therapy) or refractory (defined as failure to achieve CR or PR to most recent therapy), grade 1-3a follicular lymphoma (FL) who had previously received at least two prior systemic therapies including an anti-CD20 antibody and an appropriate alkylator-based combination therapy, were enrolled. Patients were randomized 2:1 to either zanubrutinib 160 mg orally twice daily until progressive disease or unacceptable toxicity, in combination with obinutuzumab 1000 mg intravenously (arm A) or obinutuzumab alone (arm B). Obinutuzumab was given on Day 1, 8, and 15 of the first cycle, then at Day 1 of cycles 2-6. Each cycle was 28 days long. Patients received optional obinutuzumab maintenance, one infusion every other cycle, for a maximum of 20 doses.
Patients randomized in obinutuzumab arm were allowed to crossover and to receive the combination of zanubrutinib plus obinutuzumab in case of progressive disease or absence of response (defined by stable disease as best response) after 12 cycles. Randomization was stratified by the number of prior lines of therapy (2 to 3 versus ˃3), rituximab-refractory status (yes versus no), and geographic region (China versus other countries).
Baseline demographics and disease characteristics were generally balanced between the zanubrutinib combination arm and the obinutuzumab monotherapy arm in the 217 randomized patients. The median age was 64 years (range: 31 to 88), 49.8% were male, and 64.1% White. Most (97.2%) of the patients had a baseline ECOG performance status of 0 or 1.
At screening, most patients were Ann Arbor Stage III or IV (179 patients [82.5%]). Eighty-eight patients (40.6%) had bulky disease (defined as >1 baseline target lesion measuring >5 cm diameter). One hundred and twenty-three patients (56.7%) met the GELF criteria.
The median number of prior anticancer therapy was 3 lines (range: 2 to 11 lines). All 217 patients received >2 prior lines of therapy that included rituximab therapy (as a monotherapy or in combination with chemotherapy), and 59 of the 217 patients (27.2%) received >3 prior lines of therapy. Of the 217 patients, 114 (52.5%) were refractory to rituximab (defined as failure to respond to, or progression during, any previous rituximab-containing regimen [monotherapy or combined with chemotherapy], or progression within 6 months of the last rituximab dose, in the induction or maintenance treatment settings). Twelve (5.5%) patients received prior obinutuzumab.
Of 217 patients total, 145 were randomized to the zanubrutinib combination arm and 72 were randomized to the obinutuzumab monotherapy arm. The median follow-up time on was 20.21 months in the zanubrutinib obinutuzumab combination arm and 20.40 months in the obinutuzumab monotherapy arm. Median duration of zanubrutinib exposure was 12.16 months.
Of 72 patients randomized in the obinutuzumab monotherapy arm, 35 did crossover to combination therapy.
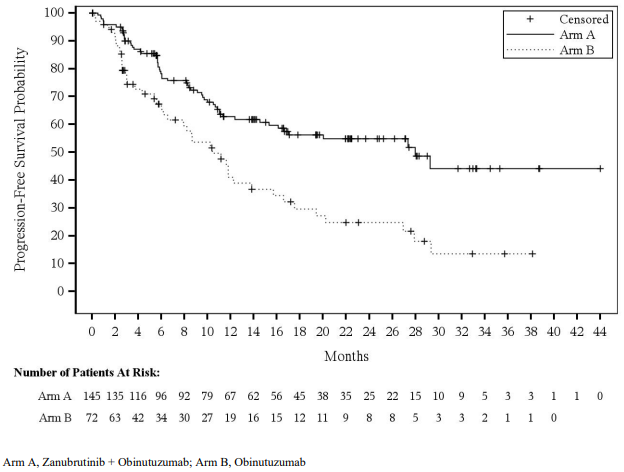
The primary efficacy endpoint was overall response rate (defined partial response or complete response) as determined by independent central review using the Lugano Classification for NHL. Main secondary endpoints included duration of response (DOR), progression-free survival (PFS) and overall survival (OS). Efficacy results are summarized in Table 10 and Figure 4.
Table 10. Efficacy Results Per Independent Central Review (ITT) (ROSEWOOD study):
| Zanubrutinib + Obinutuzumab (N=145) n (%) | Obinutuzumab (N=72) n (%) | |
|---|---|---|
| Overall Response Rate, n (%) (95% CIa) | 100 (69.0) (60.8, 76.4) | 33 (45.8) (34.0, 58.0) |
| P valueb | 0.0012 | |
| CR | 57 (39.3) | 14 (19.4) |
| PR | 43 (29.7) | 19 (26.4) |
| Duration of Response (Months) | ||
| Median (95% CI)c | NE (25.3, NE) | 14 (9.2, 25.1) |
| DOR Rate at 12-months (95% CI)d | 72.8 (62.1, 80.9) | 55.1 (34.4, 71.6) |
| DOR Rate at 18-months (95% CI)d | 69.3 (57.8, 78.2) | 41.9 (22.6, 60.1) |
| Progression-free Survival (Months) | ||
| Median (95% CI)c | 28.0 (16.1, NE) | 10.4 (6.5, 13.8) |
Overall Response Rate: CR + PR, CR: complete response, PR: partial response
a Estimated using the Clopper-Pearson method.
b Cochran-Mantel-Haenszel method stratified by rituximab-refractory status, number of prior lines of therapy, and geographic region per IRT.
c Medians estimated by Kaplan-Meier method; 95% CIs estimated by Brookmeyer and Crowley method.
d DOR rates estimated by Kaplan-Meier method; 95% CIs estimated using the Greenwood's formula. DOR was not type I error controlled and the CIs are nominal in nature.
Figure 4. Kaplan-Meier Plot of Progression-Free Survival by Independent Central Review (ITT):
Overall Survival
Twenty-nine patients (20.0%) in the combination arm and 22 patients (30.6%) in the obinutuzumab monotherapy arm died. At 18 months, overall survival rates were 84.6% (95% CI: 77.1, 89.8) in the combination arm and 73.5% (95% CI: 60.7, 82.7) in the obinutuzumab monotherapy arm. OS analysis may be confounded by 35 patients (48.6%) who crossed over from obinutuzumab monotherapy arm to combination arm.
Paediatric population
The European Medicines Agency has waived the obligation to submit the results of studies with BRUKINSA in all subsets of the paediatric population for the treatment of lymphoplasmacytic lymphoma and for the treatment of mature B-cell neoplasms (see section 4.2 for information on paediatric use).
5.2. Pharmacokinetic properties
Zanubrutinib maximum plasma concentration (Cmax) and area under the plasma drug concentration over time curve (AUC) increase proportionally over a dose range from 40 mg to 320 mg (0.13 to 1 time the recommended total daily dose). Limited systemic accumulation of zanubrutinib was observed following repeated administration for one week.
The geometric mean (%CV) zanubrutinib steady-state daily AUC is 2,099 (42%) ng h/mL following 160 mg twice daily and 1,917 (59%) ng h/mL following 320 mg once daily. The geometric mean (%CV) zanubrutinib steady-state Cmax is 299 (56%) ng/mL following 160 mg twice daily and 533 (55%) ng/mL following 320 mg once daily.
Absorption
The median tmax of zanubrutinib is 2 hours. No clinically significant differences in zanubrutinib AUC or Cmax were observed following administration of a high-fat meal (approximately 1,000 calories with 50% of total caloric content from fat) in healthy subjects.
Distribution
The geometric mean (%CV) apparent steady-state volume of distribution of zanubrutinib during the terminal phase (Vz/F) was 522 L (71%). The plasma protein binding of zanubrutinib is approximately 94% and the blood-to-plasma ratio was 0.7-0.8.
Metabolism
Zanubrutinib is primarily metabolized by cytochrome P450(CYP)3A.
Elimination
The mean half-life (t½) of zanubrutinib is approximately 2 to 4 hours following a single oral zanubrutinib dose of 160 mg or 320 mg. The geometric mean (%CV) apparent oral clearance (CL/F) of zanubrutinib during the terminal phase was 128 (61%) L/h. Following a single radiolabelled zanubrutinib dose of 320 mg to healthy subjects, approximately 87% of the dose was recovered in faeces (38% unchanged) and 8% in urine (less than 1% unchanged).
Special populations
Elderly
Age (19 to 90 years; mean age 65±12.5) had no clinically meaningful effect on zanubrutinib pharmacokinetics based on population PK analysis (N=1291).
Paediatric population
No pharmacokinetic studies were performed with zanubrutinib in patients under 18 years of age.
Gender
Gender (872 males and 419 females) had no clinically meaningful effect on zanubrutinib pharmacokinetics based on population PK analysis.
Race
Race (964 White, 237 Asian, 30 Black, and 25 categorized as Other) had no clinically meaningful effect on zanubrutinib pharmacokinetics based on population PK analysis.
Body weight
Body weight (36 to 149 kg, mean weight 76.5±16.9 kg) had no clinically meaningful effect on zanubrutinib pharmacokinetics based on population PK analysis (N=1291).
Renal impairment
Zanubrutinib undergoes minimal renal elimination. Based on population PK analysis, mild and moderate renal impairment (CrCl ≥30 mL/min as estimated by Cockcroft-Gault equation) had no influence on the exposure of zanubrutinib. The analysis was based on 362 patients with normal renal function, 523 with mild renal impairment, 303 with moderate renal impairment, 11 with severe renal impairment, and one with ESRD. The effects of severe renal impairment (CrCl <30 mL/min) and dialysis on zanubrutinib pharmacokinetics is unknown.
Hepatic impairment
The total AUC of zanubrutinib increased by 11% in subjects with mild hepatic impairment (ChildPugh class A), by 21% in subjects with moderate hepatic impairment (Child-Pugh class B), and by 60% in subjects with severe hepatic impairment (Child-Pugh class C) relative to subjects with normal liver function. The unbound AUC of zanubrutinib increased by 23% in subjects with mild hepatic impairment (Child-Pugh class A), by 43% in subjects with moderate hepatic impairment (Child-Pugh class B), and by 194% in subjects with severe hepatic impairment (Child-Pugh class C) relative to subjects with normal liver function. A significant correlation was observed between the Child-Pugh score, baseline serum albumin, baseline serum bilirubin and baseline prothrombin time with unbound zanubrutinib AUC.
In vitro studies
CYP enzymes
Zanubrutinib is a weak inducer of CYP2B6 and CYP2C8. Zanubrutinib is not an inducer of CYP1A2.
Co-administration with transport substrates/inhibitors
Zanubrutinib is likely to be a substrate of P-gp. Zanubrutinib is not a substrate or inhibitor of OAT1, OAT3, OCT2, OATP1B1, or OATP1B3.
Pharmacodynamic interactions
An in vitro study showed that the potential pharmacodynamic interaction between zanubrutinib and rituximab is low and zanubrutinib is unlikely to interfere with the anti-CD20 antibody-induced antibody-dependent cellular cytotoxicity (ADCC) effect.
In vitro, ex vivo, and animal studies showed that zanubrutinib had no or minimal effects on platelet activation, glycoprotein expression, and thrombus formation.
5.3. Preclinical safety data
General toxicity
The general toxicologic profiles of zanubrutinib were characterized orally in Sprague-Dawley rats for up to 6-month treatment and in beagle dogs for up to 9-month treatment.
In rat repeat dose studies up to 6-month treatment, test article related mortality was noted at the dose of 1,000 mg/kg/day (81x clinical AUC) with histopathologic findings in the gastrointestinal tract. Other findings were mainly noted in the pancreas (atrophy, fibroplasia, haemorrhage, and/or inflammatory cell infiltration) at the doses ≥30 mg/kg/day (3x clinical AUC), in the skin around the nose/mouth/eyes (inflammatory cell infiltration, erosion/ulcer) from the dose of 300 mg/kg/day (16x clinical AUC), and in the lung (presence of macrophages in the alveolar) at the dose of 300 mg/kg/day. All these findings were fully or partially reversed after a 6-week recovery except for the pancreatic findings which were not considered clinically relevant.
In dog repeat dose studies up to 9-month treatment, test article related findings were mainly noted in the gastrointestinal tract (soft/watery/mucoid stool), skin (rash, red discoloration, and thickened/ scaling), and in the mesenteric, mandibular, and gut associated lymph nodes and spleen (lymphoid depletion or erythrophagocytosis) at the doses from 10 mg/kg/day (3x clinical AUC) to 100 mg/kg/day (18x clinical AUC). All these findings were fully or partially reversed after a 6-week recovery.
Carcinogenicity/genotoxicity
Carcinogenicity studies have not been conducted with zanubrutinib.
Zanubrutinib was not mutagenic in a bacterial mutagenicity (Ames) assay, was not clastogenic in a chromosome aberration assay in mammalian (Chinese hamster ovary) cells, nor was it clastogenic in an in vivo bone marrow micronucleus assay in rats.
Developmental and reproductive toxicity
A combined male and female fertility and early embryonic development study was conducted in rats at oral zanubrutinib doses of 30, 100 and 300 mg/kg/day. No effect on male or female fertility was noted but at the highest dose tested, morphological abnormalities in sperm and increased postimplantation loss were noted. The dose of 100 mg/kg/day is approximately 13-fold higher than the human therapeutic exposure.
Embryo-foetal development toxicity studies were conducted in both rats and rabbits. Zanubrutinib was administered orally to pregnant rats during the period of organogenesis at doses of 30, 75, and 150 mg/kg/day. Malformations in the heart (2- or 3-chambered hearts with the incidence of 0.3%-1.5%) were noted at all dose levels in the absence of maternal toxicity. The dose of 30 mg/kg/day is approximately 5-fold higher than the human therapeutic exposure.
Administration of zanubrutinib to pregnant rabbits during the period of organogenesis at 30, 70, and 150 mg/kg/day resulted in post-implantation loss at the highest dose. The dose of 70 mg/kg is approximately 25-fold higher than the human therapeutic exposure and was associated with maternal toxicity.
In a pre- and post-natal developmental toxicity study, zanubrutinib was administered orally to rats at doses of 30, 75, and 150 mg/kg/day from implantation through weaning. The offspring from the middle and high dose groups had decreased body weights preweaning, and all dose groups had adverse ocular findings (e.g., cataract, protruding eye). The dose of 30 mg/kg/day is approximately 5-fold higher than the human therapeutic exposure.
© All content on this website, including data entry, data processing, decision support tools, "RxReasoner" logo and graphics, is the intellectual property of RxReasoner and is protected by copyright laws. Unauthorized reproduction or distribution of any part of this content without explicit written permission from RxReasoner is strictly prohibited. Any third-party content used on this site is acknowledged and utilized under fair use principles.