RINVOQ Prolonged-release tablet Ref.[111593] Active ingredients: Upadacitinib
Source: European Medicines Agency (EU) Revision Year: 2025 Publisher: AbbVie Deutschland GmbH & Co. KG, Knollstrasse, 67061 Ludwigshafen, Germany
5.1. Pharmacodynamic properties
Pharmacotherapeutic group: Immunosuppressants, Janus-associated kinase (JAK) inhibitors
ATC code: L04AF03
Mechanism of action
Upadacitinib is a selective and reversible Janus kinase (JAK) inhibitor. JAKs are intracellular enzymes that transmit cytokine or growth factor signals involved in a broad range of cellular processes including inflammatory responses, hematopoiesis, and immune surveillance. The JAK family of enzymes contains four members, JAK1, JAK2, JAK3 and TYK2 which work in pairs to phosphorylate and activate signal transducers and activators of transcription (STATs). This phosphorylation, in turn, modulates gene expression and cellular function. JAK1 is important in inflammatory cytokine signals while JAK2 is important for red blood cell maturation and JAK3 signals play a role in immune surveillance and lymphocyte function.
In human cellular assays, upadacitinib preferentially inhibits signalling by JAK1 or JAK1/3 with functional selectivity over cytokine receptors that signal via pairs of JAK2. Atopic dermatitis is driven by pro-inflammatory cytokines (including IL-4, IL-13, IL-22, TSLP, IL-31 and IFN-γ) that transduce signals via the JAK1 pathway. Inhibiting JAK1 with upadacitinib reduces the signaling of many mediators which drive the signs and symptoms of atopic dermatitis such as eczematous skin lesions and pruritus. Pro-inflammatory cytokines (primarily IL-6, IL-7, IL-15 and IFNγ) transduce signals via the JAK1 pathway and are involved in the pathology of inflammatory bowel diseases. JAK1 inhibition with upadacitinib modulates the signalling of the JAK-dependent cytokines underlying the inflammatory burden and signs and symptoms of inflammatory bowel diseases.
Pharmacodynamic effects
Inhibition of IL-6 induced STAT3 and IL-7 induced STAT5 phosphorylation
In healthy volunteers, the administration of upadacitinib (immediate-release formulation) resulted in a dose- and concentration-dependent inhibition of IL-6 (JAK1/JAK2) - induced STAT3 and IL-7 (JAK1/JAK3)-induced STAT5 phosphorylation in whole blood. The maximal inhibition was observed 1 hour after dosing which returned to near baseline by the end of dosing interval.
Lymphocytes
In patients with rheumatoid arthritis, treatment with upadacitinib was associated with a small, transient increase in mean ALC from baseline up to week 36 which gradually returned to at or near baseline levels with continued treatment.
hsCRP
In patients with rheumatoid arthritis, treatment with upadacitinib was associated with decreases from baseline in mean hsCRP levels as early as week 1 which were maintained with continued treatment.
Vaccine studies
The influence of upadacitinib on the humoral response following administration of adjuvanted recombinant glycoprotein E herpes zoster vaccine was evaluated in 93 patients with rheumatoid arthritis under stable treatment with upadacitinib 15 mg. 98% of patients were on concomitant methotrexate. 49% of patients were on oral corticosteroids at baseline. The primary endpoint was the proportion of patients with a satisfactory humoral response defined as ≥4-fold increase in pre-vaccination concentration of anti-glycoprotein E titer levels at week 16 (4 weeks post-dose 2 vaccination). Vaccination of patients treated with upadacitinib 15 mg resulted in a satisfactory humoral response in 79/90 (88% [95% CI: 81.0, 94.5]) of patients at week 16.
The influence of upadacitinib on the humoral response following the administration of inactivated pneumococcal polysaccharide conjugate vaccine (13-valent, adsorbed) was evaluated in 111 patients with rheumatoid arthritis under stable treatment with upadacitinib 15 mg (n=87) or 30 mg (n=24). 97% of patients (n=108) were on concomitant methotrexate. The primary endpoint was the proportion of patients with satisfactory humoral response defined as ≥ 2-fold increase in antibody concentration from baseline to week 4 in at least 6 out of the 12 pneumococcal antigens (1, 3, 4, 5, 6B, 7F, 9V, 14, 18C, 19A, 19F, and 23F). Results at week 4 demonstrated a satisfactory humoral response in 67.5% (95% CI: 57.4, 77.5) and 56.5% (95% CI: 36.3, 76.8) of patients treated with upadacitinib 15 mg and 30 mg, respectively.
Clinical efficacy and safety
Rheumatoid arthritis
The efficacy and safety of upadacitinib 15 mg once daily was assessed in five Phase 3 randomised, double-blind, multicentre studies in patients with moderately to severely active rheumatoid arthritis and fulfilling the ACR/EULAR 2010 classification criteria (see Table 4). Patients 18 years of age and older were eligible to participate. The presence of at least 6 tender and 6 swollen joints and evidence of systemic inflammation based on elevation of hsCRP was required at baseline. Four studies included long-term extensions for up to 5 years, and one study (SELECT-COMPARE) included a long-term extension for up to 10 years.
The primary analysis for each of these studies included all randomised subjects who received at least 1 dose of upadacitinib or placebo, and non-responder imputation was used for categorical endpoints.
Across the Phase 3 studies, the efficacy seen with upadacitinib 15 mg QD was generally similar to that observed with upadacitinib 30 mg QD.
Table 4. Clinical trials summary:
| Study name | Population (n) | Treatment arms | Key outcome measures |
|---|---|---|---|
| SELECT-EARLY | MTX-naïvea (947) | • Upadacitinib 15 mg • Upadacitinib 30 mg • MTX Monotherapy | • Primary endpoint: clinical remission (DAS28-CRP) at week 24 • Low disease activity (DAS28-CRP) • ACR50 • Radiographic progression (mTSS) • Physical function (HAQ-DI) • SF-36 PCS |
| SELECT- MONOTHERAPY | MTX-IRb (648) | • Upadacitinib 15 mg • Upadacitinib 30 mg • MTX Monotherapy | • Primary endpoint: low disease activity (DAS28-CRP) at week 14 • Clinical remission (DAS28-CRP) • ACR20 • Physical function (HAQ-DI) • SF-36 PCS • Morning stiffness |
| SELECT-NEXT | csDMARD-IRc (661) | • Upadacitinib 15 mg • Upadacitinib 30 mg • Placebo On background csDMARDs | • Primary endpoint: low disease activity (DAS28-CRP) at week 12 • Clinical remission (DAS28-CRP) • ACR20 • Physical function (HAQ-DI) • SF-36 PCS • Low disease activity (CDAI) • Morning stiffness • FACIT-F |
| SELECT- COMPARE | MTX-IRd (1,629) | • Upadacitinib 15 mg • Placebo • Adalimumab 40 mg On background MTX | • Primary endpoint: clinical remission (DAS28-CRP) at week 12 • Low disease activity (DAS28-CRP) • ACR20 • Low disease activity (DAS28-CRP) vs adalimumab • Radiographic progression (mTSS) • Physical function (HAQ-DI) • SF-36 PCS • Low disease activity (CDAI) • Morning stiffness • FACIT-F |
| SELECT- BEYOND | bDMARD-IRe (499) | • Upadacitinib 15 mg • Upadacitinib 30 mg • Placebo On background csDMARDs | • Primary endpoint: low disease activity (DAS28-CRP) at week 12 • ACR20 • Physical function (HAQ-DI) • SF-36 PCS |
Abbreviations: ACR20 (or 50) = American College of Rheumatology ≥20% (or ≥50%) improvement; bDMARD = biologic disease-modifying anti-rheumatic drug, CRP = C-Reactive Protein, DAS28 = Disease Activity Score 28 joints, mTSS = modified Total Sharp Score, csDMARD = conventional synthetic disease-modifying anti-rheumatic drug, HAQ-DI = Health Assessment Questionnaire-Disability Index, SF-36 PCS = Short Form (36) Health Survey (SF-36) Physical Component Summary, CDAI = Clinical Disease Activity Index, FACIT-F = Functional Assessment of Chronic Illness Therapy-Fatigue score, IR = inadequate responder, MTX = methotrexate, n = number randomised
a Patients were naïve to MTX or received no more than 3 weekly MTX doses
b Patients had inadequate response to MTX
c Patients who had an inadequate response to csDMARDs; patients with prior exposure to at most one bDMARD were eligible (up to 20% of total number of patients) if they had either limited exposure (<3 months) or had to discontinue the bDMARD due to intolerability
d Patients who had an inadequate response to MTX; patients with prior exposure to at most one bDMARD (except adalimumab) were eligible (up to 20% of total study number of patients) if they had either limited exposure (<3 months) or had to discontinue the bDMARD due to intolerability
e Patients who had an inadequate response or intolerance to at least one bDMARD
Clinical response
Remission and low disease activity:
In the studies, a significantly higher proportion of patients treated with upadacitinib 15 mg achieved low disease activity (DAS28-CRP ≤3.2) and clinical remission (DAS28-CRP <2.6) compared to placebo, MTX, or adalimumab (Table 5). Compared to adalimumab, significantly higher rates of low disease activity were achieved at week 12 in SELECT-COMPARE. Overall, both low disease activity and clinical remission rates were consistent across patient populations, with or without MTX. At 3 years, 297/651 (45.6%) and 111/327 (33.9%) patients remained on originally randomised treatment of upadacitinib 15 mg or adalimumab, respectively, in SELECT-COMPARE, and 216/317 (68.1%) and 149/315 (47.3%) patients remained on originally randomised treatment of upadacitinib 15 mg or MTX monotherapy, respectively, in SELECT-EARLY. Among the patients who remained on their originally allocated treatment, low disease activity and clinical remission were maintained through 3 years.
ACR response:
In all studies, more patients treated with upadacitinib 15 mg achieved ACR20, ACR50, and ACR70 responses at 12 weeks compared to placebo, MTX, or adalimumab (Table 5). Time to onset of efficacy was rapid across measures with greater responses seen as early as week 1 for ACR20. Durable response rates were observed (with or without MTX), with ACR20/50/70 responses maintained through 3 years among the patients who remained on their originally allocated treatment.
Treatment with upadacitinib 15 mg, alone or in combination with csDMARDs, resulted in improvements in individual ACR components, including tender and swollen joint counts, patient and physician global assessments, HAQ-DI, pain assessment and hsCRP.
Table 5. Response and remission:
| Study | SELECT EARLY MTX-Naїve | SELECT MONO MTX-IR | SELECT NEXT csDMARD-IR | SELECT COMPARE MTX-IR | SELECT BEYOND bDMARD-IR | ||||||||||||||||||
|---|---|---|---|---|---|---|---|---|---|---|---|---|---|---|---|---|---|---|---|---|---|---|---|
| MTX | UPA 15mg | MTX | UPA 15mg | PBO | UPA 15mg | PBO | UPA 15mg | ADA 40mg | PBO | UPA 15mg | |||||||||||||
| N | 314 | 317 | 216 | 217 | 221 | 221 | 651 | 651 | 327 | 169 | 164 | ||||||||||||
| Week | |||||||||||||||||||||||
| LDA DAS28-CRP ≤3.2 (% of patients) | |||||||||||||||||||||||
| 12a/14b | 28 | 53g | 19 | 45e | 17 | 48e | 14 | 45e,h | 29 | 14 | 43e | ||||||||||||
| 24c/26d | 32 | 60f | 18 | 55g,h | 39 | ||||||||||||||||||
| 48 | 39 | 59g | 50h | 35 | |||||||||||||||||||
| CR DAS28-CRP <2.6 (% of patients) | |||||||||||||||||||||||
| 12a/14b | 14 | 36g | 8 | 28e | 10 | 31e | 6 | 29e,h | 18 | 9 | 29g | ||||||||||||
| 24c/26d | 18 | 48e | 9 | 41g,h | 27 | ||||||||||||||||||
| 48 | 29 | 49g | 38i | 28 | ACR20 (% of patients) | ||||||||||||||||||
| 12a/14b | 54 | 76g | 41 | 68e | 36 | 64e | 36 | 71e,j | 63 | 28 | 65e | ||||||||||||
| 24c/26d | 59 | 79g | 36 | 67g,i | 57 | ||||||||||||||||||
| 48 | 57 | 74g | 65i | 54 | |||||||||||||||||||
| ACR50 (% of patients) | |||||||||||||||||||||||
| 12a/14b | 28 | 52g | 15 | 42g | 15 | 38g | 15 | 45g,h | 29 | 12 | 34g | ||||||||||||
| 24c/26d | 33 | 60e | 21 | 54g,h | 42 | ||||||||||||||||||
| 48 | 43 | 63g | 49i | 40 | |||||||||||||||||||
| ACR70 (% of patients) | |||||||||||||||||||||||
| 12a/14b | 14 | 32g | 3 | 23g | 6 | 21g | 5 | 25g,h | 13 | 7 | 12 | ||||||||||||
| 24c/26d | 18 | 44g | 10 | 35g,h | 23 | ||||||||||||||||||
| 48 | 29 | 51g | 36h | 23 | |||||||||||||||||||
| CDAI ≤10 (% of patients) | |||||||||||||||||||||||
| 12a/14b | 30 | 46g | 25 | 35l | 19 | 40e | 16 | 40e,h | 30 | 14 | 32g | ||||||||||||
| 24c/26d | 38 | 56g | 22 | 53g,h | 38 | ||||||||||||||||||
| 48 | 43 | 60g | 47h | 34 | |||||||||||||||||||
Abbreviations: ACR20 (or 50 or 70) = American College of Rheumatology ≥20% (or ≥50% or ≥70%) improvement; ADA = adalimumab; CDAI = Clinical Disease Activity Index; CR = Clinical Remission; CRP = C-Reactive Protein, DAS28 = Disease Activity Score 28 joints; IR = inadequate responder; LDA = Low Disease Activity; MTX = methotrexate; PBO = placebo; UPA= upadacitinib
a SELECT-NEXT, SELECT-EARLY, SELECT-COMPARE, SELECT-BEYOND
b SELECT-MONOTHERAPY
c SELECT-EARLY
d SELECT-COMPARE
e multiplicity-controlled p≤0.001upadacitinib vs placebo or MTX comparison
f multiplicity-controlled p≤0.01 upadacitinib vs placebo or MTX comparison
g nominal p≤0.001 upadacitinib vs placebo or MTX comparison
h nominal p≤0.001upadacitinib vs adalimumab comparison
i nominal p≤0.01 upadacitinib vs adalimumab comparison
j nominal p<0.05 upadacitinib vs adalimumab comparison
k nominal p≤0.01 upadacitinib vs placebo or MTX comparison
l nominal p<0.05 upadacitinib vs MTX comparison
Note: Week 48-data derived from analysis on Full Analysis set (FAS) by randomised group using Non-Responder Imputation
Radiographic response:
Inhibition of progression of structural joint damage was assessed using the modified Total Sharp Score (mTSS) and its components, the erosion score and joint space narrowing score, at weeks 24/26 and week 48 in SELECT-EARLY and SELECT-COMPARE.
Treatment with upadacitinib 15 mg resulted in significantly greater inhibition of the progression of structural joint damage compared to placebo in combination with MTX in SELECT-COMPARE and as monotherapy compared to MTX in SELECT-EARLY (Table 6). Analyses of erosion and joint space narrowing scores were consistent with the overall scores. The proportion of patients with no radiographic progression (mTSS change ≤ 0) was significantly higher with upadacitinib 15 mg in both studies. Inhibition of progression of structural joint damage was maintained through week 96 in both studies for patients who remained on their originally allocated treatment with upadacitinib 15 mg (based on available results from 327 patients in SELECT-COMPARE and 238 patients in SELECT-EARLY).
Table 6. Radiographic changes:
| Study | SELECT EARLY MTX-Naїve | SELECT COMPARE MTX-IR | |||
|---|---|---|---|---|---|
| Treatment Group | MTX | UPA 15 mg | PBOa | UPA 15 mg | ADA 40 mg |
| Modified Total Sharp Score, mean change from baseline | |||||
| Week 24b/26c | 0.7 | 0.1f | 0.9 | 0.2g | 0.1 |
| Week 48 | 1.0 | 0.03e | 1.7 | 0.3e | 0.4 |
| Proportion of patients with no radiographic progressiond | |||||
| Week 24b/26c | 77.7 | 87.5f | 76.0 | 83.5f | 86.8 |
| Week 48 | 74.3 | 89.9e | 74.1 | 86.4e | 87.9 |
Abbreviations: ADA = adalimumab; IR = inadequate responder; MTX = methotrexate; PBO = placebo; UPA= upadacitinib
a All placebo data at week 48 derived using linear extrapolation
b SELECT-EARLY
c SELECT-COMPARE
d No progression defined as mTSS change ≤0
e nominal p≤0.001 upadacitinib vs placebo or MTX comparison
f multiplicity-controlled p≤0.01 upadacitinib vs placebo or MTX comparison
g multiplicity-controlled p≤0.001 upadacitinib vs placebo or MTX comparison
Physical function response and health-related outcomes:
Treatment with upadacitinib 15 mg, alone or in combination with csDMARDs, resulted in a significantly greater improvement in physical function compared to all comparators as measured by HAQ-DI (see Table 7). Improvement in HAQ-DI was maintained through 3 years for patients who remained on their originally allocated treatment with upadacitinib 15 mg based on available results from SELECT-COMPARE and SELECT-EARLY.
Table 7. Mean change from baseline in HAQ-DIa,b:
| Study | SELECT EARLY MTX-Naїve | SELECT MONO MTX-IR | SELECT NEXT csDMARD-IR | SELECT COMPARE MTX-IR | SELECT BEYOND BIO-IR | ||||||
|---|---|---|---|---|---|---|---|---|---|---|---|
| Treatment group | MTX | UPA 15mg | MTX | UPA 15mg | PBO | UPA 15mg | PBO | UPA 15mg | ADA 40mg | PBO | UPA 15mg |
| N | 313 | 317 | 216 | 216 | 220 | 216 | 648 | 644 | 324 | 165 | 163 |
| Baseline score, mean | 1.6 | 1.6 | 1.5 | 1.5 | 1.4 | 1.5 | 1.6 | 1.6 | 1.6 | 1.6 | 1.7 |
| Week 12c/14d | -0.5 | -0.8h | -0.3 | -0.7g | -0.3 | -0.6g | -0.3 | -0.6g,i | -0.5 | -0.2 | -0.4g |
| Week 24e/26f | -0.6 | -0.9g | -0.3 | -0.7h,i | -0.6 | ||||||
Abbreviations: ADA = adalimumab; HAQ-DI = Health Assessment Questionnaire-Disability Index; IR = inadequate responder; MTX = methotrexate; PBO = placebo; UPA = upadacitinib
a Data shown are mean
b Health Assessment Questionnaire-Disability Index: 0=best, 3=worst; 20 questions; 8 categories: dressing and grooming, arising, eating, walking, hygiene, reach, grip, and activities.
c SELECT-EARLY, SELECT-NEXT, SELECT-COMPARE, SELECT-BEYOND
d SELECT-MONOTHERAPY
e SELECT-EARLY
f SELECT-COMPARE
g multiplicity-controlled p≤0.001 upadacitinib vs placebo or MTX comparison
h nominal p≤0.001 upadacitinib vs placebo or MTX comparison
i nominal p≤0.01 upadacitinib vs adalimumab comparison
In the studies SELECT-MONOTHERAPY, SELECT-NEXT, and SELECT-COMPARE, treatment with upadacitinib 15 mg resulted in a significantly greater improvement in the mean duration of morning joint stiffness compared to placebo or MTX.
In the clinical studies, upadacitinib-treated patients reported significant improvements in patient-reported quality of life, as measured by the Short Form (36) Health Survey (SF-36) Physical Component Summary compared to placebo and MTX. Moreover, upadacitinib-treated patients reported significant improvements in fatigue, as measured by the Functional Assessment of Chronic Illness Therapy-Fatigue score (FACIT-F) compared to placebo.
Psoriatic arthritis
The efficacy and safety of upadacitinib 15 mg once daily were assessed in two Phase 3 randomised, double-blind, multicentre, placebo-controlled studies in patients 18 years of age or older with moderately to severely active psoriatic arthritis. All patients had active psoriatic arthritis for at least 6 months based upon the Classification Criteria for Psoriatic Arthritis (CASPAR), at least 3 tender joints and at least 3 swollen joints, and active plaque psoriasis or history of plaque psoriasis. For both studies, the primary endpoint was the proportion of patients who achieved an ACR20 response at week 12.
SELECT-PsA 1 was a 24-week trial in 1705 patients who had an inadequate response or intolerance to at least one non-biologic DMARD. At baseline, 1393 (82%) of patients were on at least one concomitant non-biologic DMARD; 1084 (64%) of patients received concomitant MTX only; and 311 (18%) of patients were on monotherapy. Patients received upadacitinib 15 mg or 30 mg once daily, adalimumab, or placebo. At week 24, all patients randomised to placebo were switched to upadacitinib 15 mg or 30 mg once daily in a blinded manner. SELECT-PsA 1 included a long-term extension for up to 5 years.
SELECT-PsA 2 was a 24-week trial in 642 patients who had an inadequate response or intolerance to at least one biologic DMARD. At baseline, 296 (46%) of patients were on at least one concomitant non-biologic DMARD; 222 (35%) of patients received concomitant MTX only; and 345 (54%) of patients were on monotherapy. Patients received upadacitinib 15 mg or 30 mg once daily or placebo. At week 24, all patients randomised to placebo were switched to upadacitinib 15 mg or 30 mg once daily in a blinded manner. SELECT-PsA 2 included a long-term extension for up to 3 years.
Clinical response
In both studies, a statistically significant greater proportion of patients treated with upadacitinib 15 mg achieved ACR20 response compared to placebo at week 12 (Table 8). Time to onset of efficacy was rapid across measures with greater responses seen as early as week 2 for ACR20.
Treatment with upadacitinib 15 mg resulted in improvements in individual ACR components, including tender/painful and swollen joint counts, patient and physician global assessments, HAQ-DI, pain assessment, and hsCRP compared to placebo.
In SELECT-PsA 1, upadacitinib 15 mg achieved non-inferiority compared to adalimumab in the proportion of patients achieving ACR20 response at week 12; however, superiority to adalimumab could not be demonstrated.
In both studies, consistent responses were observed alone or in combination with methotrexate for primary and key secondary endpoints.
The efficacy of upadacitinib 15 mg was demonstrated regardless of subgroups evaluated including baseline BMI, baseline hsCRP, and number of prior non-biologic DMARDs (≤1 or >1).
Table 8. Clinical response in SELECT-PsA 1 and SELECT-PsA 2:
| Study | SELECT-PsA 1 non-biologic DMARD-IR | SELECT-PsA 2 bDMARD-IR | |||
|---|---|---|---|---|---|
| Treatment Group | PBO | UPA 15 mg | ADA 40 mg | PBO | UPA 15 mg |
| N | 423 | 429 | 429 | 212 | 211 |
| ACR20, % of patients (95% CI) | |||||
| Week 12 | 36 (32, 41) | 71 (66, 75)f | 65 (61, 70) | 24 (18, 30) | 57 (50, 64) |
| Difference from placebo (95% CI) | 35 (28, 41)d,e | - | 33 (24, 42)d,e | ||
| Week 24 | 45 (40, 50) | 73 (69, 78) | 67 (63, 72) | 20 (15, 26) | 59 (53, 66) |
| Week 56 | 74 (70, 79) | 69 (64, 73) | 60 (53, 66) | ||
| ACR50, % of patients (95% CI) | |||||
| Week 12 | 13 (10, 17) | 38 (33, 42) | 38 (33, 42) | 5 (2, 8) | 32 (26, 38) |
| Week 24 | 19 (15, 23) | 52 (48, 57) | 44 (40, 49) | 9 (6, 13) | 38 (32, 45) |
| Week 56 | 60 (55, 64) | 51 (47, 56) | 41 (34, 47) | ||
| ACR70, % of patients (95% CI) | |||||
| Week 12 | 2 (1, 4) | 16 (12, 19) | 14 (11, 17) | 1 (0, 1) | 9 (5, 12) |
| Week 24 | 5 (3, 7) | 29 (24, 33) | 23 (19, 27) | 1 (0, 2) | 19 (14, 25) |
| Week 56 | 41 (36, 45) | 31 (27, 36) | 24 (18, 30) | ||
| MDA, % of patients (95% CI) | |||||
| Week 12 | 6 (4, 9) | 25 (21, 29) | 25 (21, 29) | 4 (2, 7) | 17 (12, 22) |
| Week 24 | 12 (9, 15) | 37 (32, 41)e | 33 (29, 38) | 3 (1, 5) | 25 (19, 31)e |
| Week 56 | 45 (40, 50) | 40 (35, 44) | 29 (23, 36) | ||
| Resolution of enthesitis (LEI=0), % of patients (95% CI)a | |||||
| Week 12 | 33 (27, 39) | 47 (42, 53) | 47 (41, 53) | 20 (14, 27) | 39 (31, 47) |
| Week 24 | 32 (27, 39) | 54 (48, 60)e | 47 (42, 53) | 15 (9, 21) | 43 (34, 51) |
| Week 56 | 59 (53, 65) | 54 (48, 60) | 43 (34, 51) | ||
| Resolution of dactylitis (LDI=0), % of patients (95% CI)b | |||||
| Week 12 | 42 (33, 51) | 74 (66, 81) | 72 (64, 80) | 36 (24, 48) | 64 (51, 76) |
| Week 24 | 40 (31, 48) | 77 (69, 84) | 74 (66, 82) | 28 (17, 39) | 58 (45, 71) |
| Week 56 | 75 (68, 82) | 74 (66, 82) | 51 (38, 64) | ||
| PASI75, % of patients (95% CI)c | |||||
| Week 16 | 21 (16, 27) | 63 (56, 69)e | 53 (46, 60) | 16 (10, 22) | 52 (44, 61)e |
| Week 24 | 27 (21, 33) | 64 (58, 70) | 59 (52, 65) | 19 (12, 26) | 54 (45, 62) |
| Week 56 | 65 (59, 72) | 61 (55, 68) | 52 (44, 61) | ||
| PASI90, % of patients (95% CI)c | |||||
| Week 16 | 12 (8, 17) | 38 (32, 45) | 39 (32, 45) | 8 (4, 13) | 35 (26, 43) |
| Week 24 | 17 (12, 22) | 42 (35, 48) | 45 (38, 52) | 7 (3, 11) | 36 (28, 44) |
| Week 56 | 49 (42, 56) | 47 (40, 54) | 41 (32, 49) | ||
Abbreviations: ACR20 (or 50 or 70) = American College of Rheumatology ≥20% (or ≥50% or ≥70%) improvement, ADA = adalimumab; bDMARD = biologic disease-modifying anti- rheumatic drug; IR = inadequate responder; MDA = minimal disease activity; PASI75 (or 90) = ≥75% (or ≥90%) improvement in Psoriasis Area and Severity Index; PBO = placebo; UPA = upadacitinib
Patients who discontinued randomised treatment or were missing data at week of evaluation were imputed as non-responders in the analyses. For MDA, resolution of enthesitis, and resolution of dactylitis at week 24/56, the subjects rescued at week 16 were imputed as non-responders in the analyses.
a In patients with enthesitis at baseline (n=241, 270, and 265, respectively, for SELECT-PsA 1 and n=144 and 133, respectively, for SELECT-PsA 2)
b In patients with dactylitis at baseline (n=126, 136, and 127, respectively, for SELECT-PsA 1 and n=64 and 55, respectively, for SELECT-PsA 2)
c In patients with ≥3% BSA psoriasis at baseline (n=211, 214, and 211, respectively, for SELECT-PsA 1 and n=131 and 130, respectively, for SELECT-PsA 2)
d primary endpoint
e multiplicity-controlled p≤0.001 upadacitinib vs placebo comparison
f multiplicity-controlled p≤0.001 upadacitinib vs adalimumab comparison (non-inferiority test)
Radiographic response:
In SELECT-PsA 1, inhibition of progression of structural damage was assessed radiographically and expressed as the change from baseline in modified Total Sharp Score (mTSS) and its components, the erosion score and the joint space narrowing score, at week 24.
Treatment with upadacitinib 15 mg resulted in statistically significant greater inhibition of the progression of structural joint damage compared to placebo at week 24 (Table 9). Erosion and joint space narrowing scores were consistent with the overall scores. The proportion of patients with no radiographic progression (mTSS change ≤0.5) was higher with upadacitinib 15 mg compared to placebo at week 24.
Table 9. Radiographic changes in SELECT-PsA 1:
| Treatment Group | PBO | UPA 15 mg | ADA 40 mg |
|---|---|---|---|
| Modified Total Sharp Score, mean change from baseline (95% CI) | |||
| Week 24 | 0.25 (0.13, 0.36) | -0.04 (-0.16, 0.07)c | 0.01 (-0.11, 0.13) |
| Week 56a | 0.44 (0.29, 0.59) | -0.05 (-0.20, 0.09) | -0.06 (-0.20, 0.09) |
| Proportion of patients with no radiographic progressionb, % (95% CI) | |||
| Week 24 | 92 (89, 95) | 96 (94, 98) | 95 (93, 97) |
| Week 56a | 89 (86, 92) | 97 (96, 99) | 94 (92, 97) |
Abbreviations: ADA = adalimumab; PBO = placebo; UPA= upadacitinib
a All placebo data at week 56 derived using linear extrapolation
b No progression defined as mTSS change ≤0.5
c multiplicity-controlled p≤0.001 upadacitinib vs placebo comparison
Physical function response and health-related outcomes:
In SELECT-PsA 1, patients treated with upadacitinib 15 mg showed statistically significant improvement from baseline in physical function as assessed by HAQ-DI at week 12 (-0.42 [95% CI: -0.47, -0.37]) compared to placebo (-0.14 [95% CI: -0.18, -0.09]); improvement in patients treated with adalimumab was -0.34 (95% CI: -0.38, -0.29). In SELECT-PsA 2, patients treated with upadacitinib 15 mg showed statistically significant improvement from baseline in HAQ-DI at week 12 (-0.30 [95% CI: -0.37, -0.24]) compared to placebo (-0.10 [95% CI: -0.16, -0.03]). Improvement in physical function was maintained through week 56 in both studies.
Health-related quality of life was assessed by SF-36v2. In both studies, patients receiving upadacitinib 15 mg experienced statistically significant greater improvement from baseline in the Physical Component Summary score compared to placebo at week 12. Improvements from baseline were maintained through week 56 in both studies.
Patients receiving upadacitinib 15 mg experienced statistically significant improvement from baseline in fatigue, as measured by FACIT-F score, at week 12 compared to placebo in both studies. Improvements from baseline were maintained through week 56 in both studies.
At baseline, psoriatic spondylitis was reported in 31% and 34% of patients in SELECT-PsA 1 and SELECT-PsA 2, respectively. Patients with psoriatic spondylitis treated with upadacitinib 15 mg showed improvements from baseline in Bath Ankylosing Spondylitis Disease Activity Index (BASDAI) scores compared to placebo at week 24. Improvements from baseline were maintained through week 56 in both studies.
Axial spondyloarthritis
Non-radiographic axial spondyloarthritis
The efficacy and safety of upadacitinib 15 mg once daily were assessed in a randomised, double-blind, multicentre, placebo-controlled study in patients 18 years of age or older with active non-radiographic axial spondyloarthritis. Study SELECT-AXIS 2 (nr-axSpA) was a 52-week placebo-controlled trial in 314 patients with active non-radiographic axial spondyloarthritis with an inadequate response to at least two NSAIDs or intolerance to or contraindication for NSAIDs. Patients must have had objective signs of inflammation indicated by elevated C-reactive protein (CRP) (defined as > upper limit of normal), and/or sacroiliitis on magnetic resonance imaging (MRI), and no definitive radiographic evidence of structural damage on sacroiliac joints. Patients had active disease as defined by the Bath Ankylosing Spondylitis Disease Activity Index (BASDAI) ≥4, and a Patient's Assessment of Total Back Pain score ≥4 based on a 0–10 numerical rating scale (NRS) at the Screening and Baseline Visits. At baseline, patients had symptoms of non-radiographic axial spondyloarthritis for an average of 9.1 years and 29.1% of the patients were on a concomitant csDMARD. 32.9% of the patients had an inadequate response or intolerance to bDMARD therapy. Patients received upadacitinib 15 mg once daily or placebo. At week 52, all patients randomised to placebo were switched to upadacitinib 15 mg once daily. The primary endpoint was the proportion of patients achieving an Assessment of SpondyloArthritis international Society 40 (ASAS40) response at week 14. The study included a long-term extension for up to 2 years. Of patients who were initially randomised to upadacitinib, 75% (117/156) in SELECT-AXIS 2 (nr-axSpA) continued therapy through 2 years.
Clinical response
In SELECT-AXIS 2 (nr-axSpA), a significantly greater proportion of patients treated with upadacitinib 15 mg achieved an ASAS40 response compared to placebo at week 14 (Table 10). A numerical difference between treatment groups was observed at all timepoints from week 2 to week 14.
Treatment with upadacitinib 15 mg resulted in improvements in individual ASAS components (patient global assessment of disease activity, total back pain assessment, inflammation, and function) and other measures of disease activity, including hsCRP, compared to placebo at week 14.
The efficacy of upadacitinib 15 mg was demonstrated across subgroups including gender, baseline BMI, symptom duration of non-radiographic axial spondyloarthritis, baseline hsCRP, MRI sacroiliitis, and prior use of bDMARDs.
Table 10. Clinical response in SELECT-AXIS 2 (nr-axSpA):
| Treatment Group | PBO | UPA 15 mg |
|---|---|---|
| N | 157 | 156 |
| ASAS40, % of patients (95% CI)a | ||
| Week 14 | 22.5 (16.0, 29.1) | 44.9 (37.1, 52.7) |
| Difference from placebo (95% CI) | 22.2 (12.1, 32.3)b | |
| Week 52 | 42.7 (34.9, 50.4) | 62.8 (55.2, 70.4)d |
| ASAS20, % of patients (95% CI)a | ||
| Week 14 | 43.8 (36.0, 51.5) | 66.7 (59.3, 74.1)b |
| ASAS Partial Remission, % of patients (95% CI) | ||
| Week 14 | 7.6 (3.5, 11.8) | 18.6 (12.5, 24.7)c |
| BASDAI 50, % of patients (95% CI) | ||
| Week 14 | 22.1 (15.5, 28.6) | 42.3 (34.6, 50.1)b |
| Change from baseline in ASDAS-CRP (95% CI) | ||
| Week 14 | -0.71 (-0.85, -0.56) | -1.36 (-1.50, -1.21)b |
| ASDAS Inactive Disease, % of patients (95% CI) | ||
| Week 14 | 5.2 (1.7, 8.7) | 14.1 (8.6, 19.6)c |
| ASDAS Low Disease Activity, % of patients (95% CI) | ||
| Week 14 | 18.3 (12.2, 24.4) | 42.3 (34.6, 50.1)b |
Abbreviations: ASAS20 (or ASAS40) = Assessment of SpondyloArthritis international Society ≥20% (or ≥40%) improvement; ASDAS-CRP = Ankylosing Spondylitis Disease Activity Score C-Reactive Protein; BASDAI = Bath Ankylosing Spondylitis Disease Activity Index; PBO = placebo; UPA = upadacitinib
a An ASAS20 (ASAS40) response is defined as a ≥20% (≥40%) improvement and an absolute improvement from baseline of ≥1 (≥2) unit(s) (range 0 to 10) in ≥3 of 4 domains (Patient Global, Total Back Pain, Function, and Inflammation), and no worsening in the potential remaining domain (defined as worsening ≥20% and ≥1 unit for ASAS20 or defined as worsening of >0 units for ASAS40).
b multiplicity-controlled p≤0.001 upadacitinib vs placebo comparison
c multiplicity-controlled p≤0.01 upadacitinib vs placebo comparison
d Nominal p≤0.001 for upadacitinib vs placebo comparison, according to prespecified multiplicity-controlled testing sequence
For binary endpoints, results are based on non-responder imputation in conjunction with multiple imputation. For continuous endpoints, results are based on the least squares mean change from baseline using mixed-effect models repeated measures analysis.
Efficacy was maintained through 2 years as assessed by the endpoints presented in Table 10.
Physical function response and health-related outcomes:
Patients treated with upadacitinib 15 mg showed significant improvement in physical function from baseline compared to placebo as assessed by the BASFI at week 14.
Patients treated with upadacitinib 15 mg showed significant improvements in total back pain and nocturnal back pain compared to placebo at week 14.
Patients treated with upadacitinib 15 mg showed significant improvements in health-related quality of life and overall health as measured by ASQoL and ASAS Health Index, respectively, compared to placebo at week 14.
Improvements in BASFI, total and nocturnal back pain, ASQoL and ASAS Health Index were maintained through 2 years.
Objective measure of inflammation:
Signs of inflammation were assessed by MRI and expressed as change from baseline in the Spondyloarthritis Research Consortium of Canada (SPARCC) score of the sacroiliac joints. At week 14, significant improvement of inflammatory signs in the sacroiliac joints was observed in patients treated with upadacitinib 15 mg compared to placebo. Improvement in inflammation as assessed by MRI was maintained through 2 years.
Ankylosing spondylitis (AS, radiographic axial spondyloarthritis)
The efficacy and safety of upadacitinib 15 mg once daily were assessed in two randomised, double-blind, multicentre, placebo-controlled studies in patients 18 years of age or older with active ankylosing spondylitis based upon the Bath Ankylosing Spondylitis Disease Activity Index (BASDAI) ≥4 and Patient's Assessment of Total Back Pain score ≥4. Both studies included a long-term extension for up to 2 years.
SELECT-AXIS 1 was a 14-week placebo-controlled trial in 187 ankylosing spondylitis patients with an inadequate response to at least two NSAIDs or intolerance to or contraindication for NSAIDs and had no previous exposure to biologic DMARDs. At baseline, patients had symptoms of ankylosing spondylitis for an average of 14.4 years and approximately 16% of the patients were on a concomitant csDMARD. Patients received upadacitinib 15 mg once daily or placebo. At week 14, all patients randomised to placebo were switched to upadacitinib 15 mg once daily. The primary endpoint was the proportion of patients achieving an Assessment of SpondyloArthritis international Society 40 (ASAS40) response at week 14.
SELECT-AXIS 2 (AS) was a 14-week placebo-controlled trial in 420 ankylosing spondylitis patients with prior exposure to bDMARDs (77.4% had lack of efficacy to either a TNF inhibitor or interleukin- 17 inhibitor (IL-17i); 30.2% had intolerance; 12.9% had prior exposure but not lack of efficacy to two bDMARDs). At baseline, patients had symptoms of ankylosing spondylitis for an average of 12.8 years and approximately 31% of the patients were on a concomitant csDMARD. Patients received upadacitinib 15 mg once daily or placebo. At week 14, all patients randomised to placebo were switched to upadacitinib 15 mg once daily. The primary endpoint was the proportion of patients achieving an Assessment of SpondyloArthritis international Society 40 (ASAS40) response at week 14.
Of patients who were initially randomised to upadacitinib, 72% (67/93) in SELECT-AXIS 1 and 77% (163/211) in SELECT-AXIS 2 (AS) continued therapy through 2 years.
Clinical response
In both studies, a significantly greater proportion of patients treated with upadacitinib 15 mg achieved an ASAS40 response compared to placebo at week 14 (Table 11). A numerical difference between treatment groups was observed from week 2 in SELECT-AXIS 1 and week 4 in SELECT-AXIS 2 (AS) for ASAS40.
Treatment with upadacitinib 15 mg resulted in improvements in individual ASAS components (patient global assessment of disease activity, total back pain assessment, inflammation, and function) and other measures of disease activity, including hsCRP, at week 14 compared to placebo.
The efficacy of upadacitinib 15 mg was demonstrated regardless of subgroups evaluated including gender, baseline BMI, symptom duration of AS, baseline hsCRP, and prior use of bDMARDs.
Table 11. Clinical response:
| Study | SELECT-AXIS 1 bDMARD-naïve | SELECT-AXIS 2 (AS) bDMARD-IR | ||
|---|---|---|---|---|
| Treatment Group | PBO | UPA 15 mg | PBO | UPA 15 mg |
| N | 94 | 93 | 209 | 211 |
| ASAS40, % of patients (95% CI)a,b | ||||
| Week 14 | 25.5 (16.7, 34.3) | 51.6 (41.5, 61.8) | 18.2 (13.0, 23.4) | 44.5 (37.8, 51.3) |
| Difference from placebo (95% CI) | 26.1 (12.6, 39.5)c | 26.4 (17.9, 34.9)c | ||
| ASAS20, % of patients (95% CI)a | ||||
| Week 14 | 40.4 (30.5, 50.3) | 64.5 (54.8, 74.2)e | 38.3 (31.7, 44.9) | 65.4 (59.0, 71.8)c |
| ASAS Partial Remission, % of patients (95% CI) | ||||
| Week 14 | 1.1 (0.0, 3.1) | 19.4 (11.3, 27.4)c | 4.3 (1.6, 7.1) | 17.5 (12.4, 22.7)c |
| BASDAI 50, % of patients (95% CI) | ||||
| Week 14 | 23.4 (14.8, 32.0) | 45.2 (35.0, 55.3)d | 16.7 (11.7, 21.8) | 43.1 (36.4, 49.8)c |
| Change from baseline in ASDAS-CRP (95% CI) | ||||
| Week 14 | -0.54 (-0.71, -0.37) | -1.45 (-1.62, -1.28)c | -0.49 (-0.62, -0.37) | -1.52 (-1.64, -1.39)c |
| ASDAS Inactive Disease, % of patients (95% CI) | ||||
| Week 14 | 0 | 16.1 (8.7, 23.6)e | 1.9 (0.1, 3.8) | 12.8 (8.3, 17.3)c |
| ASDAS Low Disease Activity, % of patients (95% CI) | ||||
| Week 14 | 10.6 (4.4, 16.9) | 49.5 (39.3, 59.6)f | 10.1 (6.0, 14.2) | 44.1 (37.4, 50.8)c |
| ASDAS Major Improvement, % of patients (95% CI) | ||||
| Week 14 | 5.3 (0.8, 9.9) | 32.3 (22.8, 41.8)e | 4.8 (1.9, 7.7) | 30.3 (24.1, 36.5)e |
a An ASAS20 (ASAS40) response is defined as a ≥20% (≥40%) improvement and an absolute improvement from baseline of ≥1 (≥2) unit(s) (range 0 to 10) in ≥3 of 4 domains (Patient Global, Total Back Pain, Function, and Inflammation), and no worsening in the potential remaining domain (defined as worsening ≥20% and ≥1 unit for ASAS20 or defined as worsening of >0 units for ASAS40).
b primary endpoint
c multiplicity-controlled p≤0.001 upadacitinib vs placebo comparison
d multiplicity-controlled p≤0.01 upadacitinib vs placebo comparison
e comparison not multiplicity-controlled
f post-hoc analysis for SELECT-AXIS 1, not multiplicity-controlled
For binary endpoints, week 14 results are based on non-responder imputation (SELECT-AXIS 1) and on non-responder imputation in conjunction with multiple imputation (SELECT-AXIS 2 [AS]).
For continuous endpoints, week 14 results are based on the least squares mean change from baseline using mixed models for repeated measures analysis.
In both studies, efficacy was maintained through 2 years as assessed by the endpoints presented in Table 11.
Physical function response and health-related outcomes:
In both studies, patients treated with upadacitinib 15 mg showed significant improvement in physical function from baseline compared to placebo as assessed by the Bath Ankylosing Spondylitis Functional Index (BASFI) change from baseline at week 14. Improvement in BASFI was maintained through 2 years.
In SELECT-AXIS 2 (AS), patients treated with upadacitinib 15 mg showed significant improvements in total back pain and nocturnal back pain compared to placebo at week 14. Improvements in total back pain and nocturnal back pain were maintained through 2 years.
In SELECT-AXIS 2 (AS), patients treated with upadacitinib 15 mg showed significant improvements in health-related quality of life and overall health as measured by ASQoL and ASAS Health Index, respectively, compared to placebo at week 14. Improvements in ASQoL and ASAS Health Index were maintained through 2 years.
Enthesitis:
In SELECT-AXIS 2 (AS), patients with pre-existing enthesitis (n=310) treated with upadacitinib 15 mg showed significant improvement in enthesitis compared to placebo as measured by change from baseline in Maastricht Ankylosing Spondylitis Enthesitis Score (MASES) at week 14. Improvement in enthesitis was maintained through 2 years.
Spinal mobility:
In SELECT-AXIS 2 (AS), patients treated with upadacitinib 15 mg showed significant improvement in spinal mobility compared to placebo as measured by change from baseline in Bath Ankylosing Spondylitis Metrology Index (BASMI) at week 14. Improvement in BASMI was maintained through 2 years.
Objective measure of inflammation:
Signs of inflammation were assessed by MRI and expressed as change from baseline in the SPARCC score for spine. In both studies at week 14, significant improvement of inflammatory signs in the spine was observed in patients treated with upadacitinib 15 mg compared to placebo. Improvement in inflammation as assessed by MRI was maintained through 2 years.
Giant cell arteritis
The efficacy and safety of upadacitinib 15 mg once daily were assessed in SELECT-GCA, a Phase 3 randomised, double-blind, multicentre, placebo-controlled study in patients 50 years of age and older with new onset or relapsing giant cell arteritis. SELECT-GCA was a 52-week study in which 428 patients were randomised in a 2:1:1 ratio and dosed once daily with upadacitinib 15 mg, upadacitinib 7.5 mg, or placebo. All patients received background corticosteroid (prednisone or prednisolone) therapy. The upadacitinib-treated groups followed a pre-specified corticosteroid taper regimen with the aim to reach 0 mg by 26 weeks; the placebo-treated group followed a pre-specified corticosteroid taper regimen with the aim to reach 0 mg by 52 weeks. The primary endpoint was the proportion of patients achieving sustained remission at week 52 as defined by the absence of giant cell arteritis signs and symptoms from week 12 through week 52 and adherence to the protocol-defined corticosteroid taper regimen. Patients who prematurely discontinued study treatment (upadacitinib or placebo) or had a missing assessment were classified as non-responders. The study included a 52-week extension for a total study duration of up to 2 years.
Clinical response
Upadacitinib 15 mg and a 26-week corticosteroid taper showed superiority in achieving corticosteroid-free sustained remission at week 52 compared to placebo and a 52-week corticosteroid taper (Table 12). Results for each component of sustained remission and sustained complete remission at week 52 were consistent with those of the composite endpoints. For sustained remission at week 52 (the primary endpoint), a similar percentage of patients in each arm were classified as non-responders due to premature discontinuation of study treatment (placebo: 19.6%; upadacitinib 15 mg: 20.1%) or due to a missing assessment (placebo: 0.9%; upadacitinib 15 mg: 0.5%).
Treatment effects in subgroups (gender, age, race, prior use of interleukin-6 inhibitor, new onset or relapsing giant cell arteritis, baseline corticosteroid dose, and giant cell arteritis with or without polymyalgia rheumatica) were consistent with the results in the overall study population.
A significantly lower proportion of patients treated with upadacitinib 15 mg and a 26-week corticosteroid taper experienced at least one giant cell arteritis flare compared to those treated with placebo and a 52-week corticosteroid taper through week 52. In addition, the risk of flare in the upadacitinib arm was significantly lower compared to the placebo arm as measured by time to first flare through week 52 (Table 12).
Table 12. Clinical response in SELECT-GCA:
| Treatment Group | PBO + 52-week corticosteroid taper N=112 | UPA 15 mg + 26-week corticosteroid taper N=209 | Treatment Difference (95% CI) |
|---|---|---|---|
| Sustained remission at Week 52a | 29.0% | 46.4% | 17.1%e (6.3, 27.8) |
| Sustained complete remission at Week 52b | 16.1% | 37.1% | 20.7%f (11.3, 30.2) |
| Complete remission at Week 52c | 19.6% | 50.2% | 30.3%f (20.4, 40.2) |
| Complete remission at Week 24c | 36.1% | 57.2% | 20.8%f (9.7, 31.9) |
| Time to first GCA flare through Week 52d | 0.57e,g (0.399, 0.826) | ||
| Patients with one or more GCA flares through Week 52d | 55.6% | 34.3% | 0.47e,h (0.29, 0.74) |
Abbreviations: ESR = erythrocyte sedimentation rate; GCA = giant cell arteritis; hsCRP = high sensitivity C-reactive protein; PBO = placebo; UPA = upadacitinib
a Sustained remission is defined as having achieved both the absence of GCA signs and symptoms from Week 12 through Week 52 and adherence to the protocol-defined corticosteroid taper regimen
b Sustained complete remission is defined as having achieved absence of GCA signs and symptoms from Week 12 through Week 52, normalization of ESR (to ≤ 30 mm/hr; if ESR > 30 mm/hr and elevation is not attributable to GCA, this criterion can still be met) from Week 12 through Week 52, normalization of hsCRP to < 1 mg/dL without elevation to ≥ 1 mg/dL (on 2 consecutive visits) from Week 12 through Week 52, and adherence to the protocol-defined corticosteroid taper regimen
c Complete remission is defined as having achieved absence of GCA signs and symptoms, normalization of ESR (to ≤ 30 mm/hr; if ESR > 30 mm/hr and elevation is not attributable to GCA, this criterion can still be met), normalization of hsCRP to < 1 mg/dL, and adherence to the protocol-defined corticosteroid taper regimen
d GCA flare is defined as an event representing recurrence of GCA signs or symptoms or an ESR measurement > 30 mm/hr (attributable to GCA) and requiring an increase in corticosteroid dose, and is only considered after all of the 3 following criteria are met: absence of recurrence of GCA signs and symptoms, normalization of ESR, and no corticosteroid dose increase. Subjects who do not have an assessment that meets all 3 criteria are considered as having a GCA flare at baseline. Time to first GCA flare is calculated from the time when all three criteria above are met. Subjects who meet all 3 criteria above but never experience GCA flare are censored at the last assessment
e p ≤ 0.01
f p ≤ 0.001
g Hazard ratio
h Odds ratio
Cumulative corticosteroid dose:
Among patients who completed 52 weeks of follow-up, the cumulative corticosteroid exposure at week 52 was significantly lower in patients treated with upadacitinib 15 mg and a 26-week corticosteroid taper compared to placebo and a 52-week corticosteroid taper (median 1615 mg vs 2882 mg, respectively). The comparison of cumulative corticosteroid dose between the upadacitinib arm and the placebo arm is affected by the different pre-specified regimens for steroid tapering in the upadacitinib arm versus the placebo arm.
Health-related outcomes:
Fatigue was assessed using FACIT-Fatigue score. Patients treated with upadacitinib 15 mg and a 26-week corticosteroid taper experienced significantly greater improvement from baseline compared to placebo and a 52-week corticosteroid taper in FACIT-Fatigue score at week 52 (4.0, 95% CI: 1.33, 6.76).
Health-related quality of life was assessed using SF-36. Patients receiving upadacitinib 15 mg and a 26-week corticosteroid taper experienced significantly greater improvement from baseline compared to placebo and a 52-week corticosteroid taper in the Physical Component Summary score of SF-36 at week 52 (3.75, 95% CI: 1.39, 6.11).
Atopic dermatitis
The efficacy and safety of upadacitinib 15 mg and 30 mg once daily ware assessed in three Phase 3 randomised, double-blind, multicentre studies (MEASURE UP 1, MEASURE UP 2 and AD UP) in a total of 2782 patients (12 years of age and older). Upadacitinib was evaluated in 542 (344 in the primary analysis) adolescent and 2240 adult patients with moderate to severe atopic dermatitis (AD) not adequately controlled by topical medication(s). At baseline, patients had to have all the following: an Investigator's Global Assessment (vIGA-AD) score ≥ 3 in the overall assessment of AD (erythema, induration/papulation, and oozing/crusting) on an increasing severity scale of 0 to 4, an Eczema Area and Severity Index (EASI) score ≥16 (composite score assessing extent and severity of erythema, oedema/papulation, scratches and lichenification across 4 different body sites), a minimum body surface area (BSA) involvement of ≥ 10%, and weekly average Worst Pruritus Numerical Rating Scale (NRS) ≥ 4.
In all three studies, patients received upadacitinib once daily doses of 15 mg, 30 mg, or matching placebo for 16 weeks. In the AD UP study, patients also received concomitant topical corticosteroids (TCS). Following completion of the double blinded period, patients originally randomised to upadacitinib were to continue receiving the same dose until week 260. Patients in the placebo group were re-randomised in a 1:1 ratio to receive upadacitinib 15 mg or 30 mg until week 260.
Baseline characteristics
In the monotherapy studies (MEASURE UP 1 and 2), 50.0% of patients had a baseline vIGA-AD score of 3 (moderate) and 50.0% of patients had a baseline vIGA-AD of 4 (severe). The mean baseline EASI score was 29.3 and the mean baseline weekly average Worst Pruritus NRS was 7.3. In the concomitant TCS study (AD UP), 47.1% of patients had a baseline vIGA-AD score of 3 (moderate) and 52.9% of patients had a baseline vIGA-AD of 4 (severe). The mean baseline EASI score was 29.7 and the mean baseline weekly average Worst Pruritus NRS was 7.2.
Clinical response
Monotherapy (MEASURE UP 1 AND MEASURE UP 2) and Concomitant TCS (AD UP) studies:
A significantly greater proportion of patients treated with upadacitinib 15 mg or 30 mg achieved vIGA-AD 0 or 1, EASI 75, or a ≥4-point improvement on the Worst Pruritus NRS compared to placebo at week 16. Rapid improvements in skin clearance and itch were also achieved (see Table 12).
Figure 1 shows the proportion of patients achieving an EASI 75 response and mean percent change from baseline in Worst Pruritus NRS, respectively up to week 16 for MEASURE UP 1 and 2.
Table 12. Efficacy results of upadacitinib:
| Study | MEASURE UP 1 | MEASURE UP 2 | AD UP | ||||||
|---|---|---|---|---|---|---|---|---|---|
| Treatment Group | PBO | UPA 15 mg | UPA 30 mg | PBO | UPA 15 mg | UPA 30 mg | PBO + TCS | UPA 15 mg + TCS | UPA 30 mg + TCS |
| Number of subjects randomised | 281 | 281 | 285 | 278 | 276 | 282 | 304 | 300 | 297 |
| Week 16 endpoints, % responders (95% CI) | |||||||||
| vIGA-AD 0/1a,b (co-primary) | 8 (5,12) | 48d (42,54) | 62d (56,68) | 5 (2,7) | 39d (33,45) | 52d (46,58) | 11 (7,14) | 40d (34,45) | 59d (53,64) |
| EASI 75a (co-primary) | 16 (12,21) | 70d (64,75) | 80d (75,84) | 13 (9,17) | 60d (54,66) | 73d (68,78) | 26 (21,31) | 65d (59,70) | 77d (72,82) |
| EASI 90a | 8 (5,11) | 53d (47,59) | 66d (60,71) | 5 (3,8) | 42d (37,48) | 58d (53,64) | 13 (9,17) | 43d (37,48) | 63d (58,69) |
| EASI 100a | 2 (0,3) | 17d (12,21) | 27d (22,32) | 1 (0,2) | 14d (10,18) | 19d (14,23) | 1 (0,3) | 12e (8,16) | 23d (18,27) |
| Worst Pruritus NRSc (≥4-point improvement) | 12 (8,16) | 52d (46,58) | 60d (54,66) | 9 (6,13) | 42d (36,48) | 60d (54,65) | 15 (11,19) | 52d (46,58) | 64d (58,69) |
| Early onset endpoints, % responders (95% CI) | |||||||||
| EASI 75a (Week 2) | 4 (1,6) | 38d (32,44) | 47d 42,53) | 4 (1,6) | 33d (27,39) | 44d (38,50) | 7 (4,10) | 31d (26,36) | 44d (38,50) |
| Worst Pruritus NRS (≥4-point improvement at week 1)c,f | 0 (0,1) | 15d (11,19) | 20d (15,24) | 1 (0,2) | 7d (4,11) | 16d (11,20) | 3 (1,5) | 12d (8,16) | 19d (15,24) |
Abbreviations: UPA = upadacitinib (RINVOQ); PBO = placebo
Subjects with rescue medication or with missing data were counted as non-responders. The number and percentage of subjects who were imputed as non-responders for EASI 75 and vIGA-AD 0/1 at Week 16 due to the use of rescue therapy in the placebo, upadacitinib 15 mg, and upadacitinib 30 mg groups, respectively, were 132 (47.0%), 31 (11.0%), 16 (5.6%) in MEASURE UP 1, 119 (42.8%), 24 (8.7%), 16 (5.7%) in MEASURE UP 2, and 78 (25.7%), 15 (5.0%), 14 (4.7%) in AD UP.
a Based on number of subjects randomised
b Responder was defined as a patient with vIGA-AD 0 or 1 ("clear" or "almost clear") with a reduction of ≥2 points on a 0-4 ordinal scale
c Results shown in subset of patients eligible for assessment (patients with Worst Pruritus NRS ≥4 at baseline)
d Statistically significant vs. placebo with p<0.001
e p<0.001 vs placebo, without multiplicity control
f Statistically significant improvements vs placebo were seen as early as 1 day after initiating upadacitinib 30 mg and 2 days after initiating upadacitinib 15 mg in MEASURE UP 1 and 2
Figure 1. Proportion of patients achieving an EASI 75 response and mean percent change from baseline in Worst Pruritus NRS in MEASURE UP 1 and MEASURE UP 2:
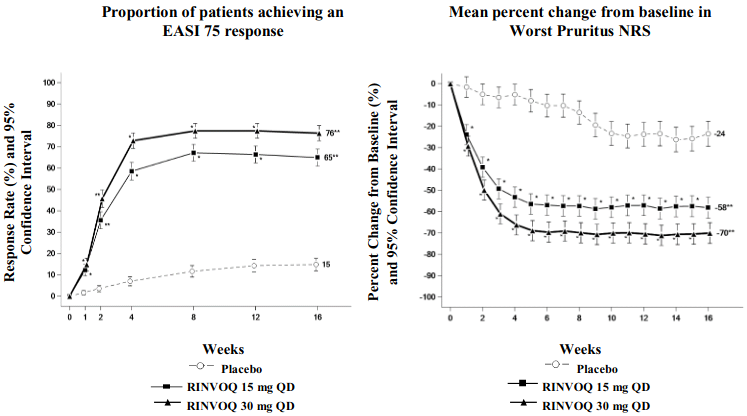
* p<0.001 vs placebo, without multiplicity control
** statistically significant vs. placebo with p<0.001
Treatment effects in subgroups (weight, age, gender, race, and prior systemic treatment with immunosuppressants) were consistent with the results in the overall study population. Results at week 16 continued to be maintained through week 52 in patients treated with upadacitinib 15 mg or 30 mg.
Quality of life/patient-reported outcomes
Table 13. Patient-reported outcomes results of upadacitinib at week 16:
| Study | MEASURE UP 1 | MEASURE UP 2 | ||||
|---|---|---|---|---|---|---|
| Treatment group | PBO | UPA 15 mg | UPA 30 mg | PBO | UPA 15 mg | UPA 30 mg |
| Number of subjects randomised | 281 | 281 | 285 | 278 | 276 | 282 |
| % responders (95% CI) | ||||||
| ADerm-SS Skin Pain (≥4-point improvement)a | 15 (10,20) | 54e (47,60) | 63e (57,69) | 13 (9,18) | 49e (43,56) | 65e (59,71) |
| ADerm-IS Sleep (≥12-point improvement)a,b | 13 (9,18) | 55e (48,62) | 66e (60,72) | 12 (8,17) | 50e (44,57) | 62e (56,69) |
| DLQI 0/1c | 4 (2,7) | 30e (25,36) | 41e (35,47) | 5 (2,7) | 24e (19,29) | 38e (32,44) |
| HADS Anxiety <8 and HADS Depression <8d | 14 (8,20) | 46e (37,54) | 49e (41,57) | 11 (6,17) | 46e (38,54) | 56e (48,64) |
Abbreviations: UPA = upadacitinib (RINVOQ); PBO = placebo; DLQI = Dermatology Life Quality Index; HADS = Hospital Anxiety and Depression Scale Subjects with rescue medication or with missing data were counted as non-responders.
The threshold values specified correspond to the minimal clinically important difference (MCID) and was used to determine response.
a Results shown in subset of patients eligible for assessment (patients with assessment score > MCID at baseline).
b ADerm-IS Sleep assesses difficulty falling asleep, sleep impact, and waking up at night due to AD.
c Results shown in subset of patients eligible for assessment (patients with DLQI >1 at baseline).
d Results shown in subset of patients eligible for assessment (patients with HADS Anxiety ≥8 or HADS Depression ≥8 at baseline)
e Statistically significant vs. placebo with p<0.001
Ulcerative colitis
The efficacy and safety of upadacitinib was evaluated in three multicentre, double-blind, placebo-controlled Phase 3 clinical studies: two replicate induction studies, UC-1 (U-ACHIEVE Induction) and UC-2 (U-ACCOMPLISH), and a maintenance study UC-3 (U-ACHIEVE Maintenance). In addition, safety and efficacy of upadacitinib were assessed in a long-term extension study, UC-4 (U-ACTIVATE).
Disease activity was based on the adapted Mayo score (aMS, Mayo scoring system excluding Physician's Global Assessment), which ranged from 0 to 9 and has three subscores that were each scored 0 (normal) to 3 (most severe): stool frequency subscore (SFS), rectal bleeding subscore (RBS) and a centrally-reviewed endoscopy subscore (ES).
Induction studies (UC-1 and UC-2)
In UC-1 and UC-2, 988 patients (473 and 515 patients, respectively) were randomised to upadacitinib 45 mg once daily or placebo for 8 weeks with a 2:1 treatment allocation ratio and included in the efficacy analysis. All enrolled patients had moderately to severely active ulcerative colitis defined as an aMS of 5 to 9 with an ES of 2 or 3 and demonstrated prior treatment failure including inadequate response, loss of response, or intolerance to prior conventional and/or biologic treatment. Prior 37 treatment failure to at least 1 biologic therapy (prior biologic failure) was seen in 52% (246/473) and 51% (262/515) of patients, respectively. Previous treatment failure to conventional therapy but not biologics (without prior biologic failure) was seen in 48% (227/473) and 49% (253/515) of patients, respectively.
At baseline in UC-1 and UC-2, 39% and 37% of patients received corticosteroids, 1.1% and 0.6% of patients received methotrexate and 68% and 69% of patients received aminosalicylates. Concomitant use of thiopurine was not allowed during the studies. Patient disease activity was moderate (aMS ≥5, ≤7) in 61% and 60% of patients and severe (aMS >7) in 39% and 40% of patients.
The primary endpoint was clinical remission per aMS at week 8. Table 15 shows the primary and key secondary endpoints including clinical response, mucosal healing, histologic-endoscopic mucosal healing and deep mucosal healing.
Table 15. Proportion of patients meeting primary and key secondary efficacy endpoints at week 8 in the induction studies UC-1 and UC-2:
| UC-1 (U-ACHIEVE) | UC-2 (U-ACCOMPLISH) | |||||
|---|---|---|---|---|---|---|
| Endpoint | PBO N=154 | UPA 45 mg N=319 | Treatment Difference (95% CI) | PBO N=174 | UPA 45 mg N=341 | Treatment Difference (95% CI) |
| Clinical remissiona | 4.8% | 26.1% | 21.6%* (15.8, 27.4) | 4.1% | 33.5% | 29.0%* (23.2, 34.7) |
| Prior biologic failure+ | 0.4% | 17.9% | 17.5% | 2.4% | 29.6% | 27.1% |
| Without prior biologic failure+ | 9.2% | 35.2% | 26.0% | 5.9% | 37.5% | 31.6% |
| Clinical responseb | 27.3% | 72.6% | 46.3%* (38.4, 54.2) | 25.4% | 74.5% | 49.4%* (41.7, 57.1) |
| Prior biologic failure+ | 12.8% | 64.4% | 51.6% | 19.3% | 69.4% | 50.1% |
| Without prior biologic failure+ | 42.1% | 81.8% | 39.7% | 31.8% | 79.8% | 48.0% |
| Mucosal healingc | 7.4% | 36.3% | 29.3%* (22.6, 35.9) | 8.3% | 44.0% | 35.1%* (28.6, 41.6) |
| Prior biologic failure+ | 1.7% | 27.0% | 25.3% | 4.8% | 37.1% | 32.3% |
| Without prior biologic failure+ | 13.2% | 46.8% | 33.6% | 12.0% | 51.2% | 39.2% |
| Histologic-endoscopic mucosal healingd | 6.6% | 30.1% | 23.7%* (17.5, 30.0) | 5.9% | 36.7% | 30.1%* (24.1, 36.2) |
| Prior biologic failure+ | 1.4% | 22.7% | 21.3% | 4.6% | 30.7% | 26.1% |
| Without prior biologic failure+ | 11.8% | 38.2% | 26.4% | 7.2% | 42.9% | 35.7% |
| Deep mucosal healinge | 1.3% | 10.7% | 9.7%* (5.7, 13.7) | 1.7% | 13.5% | 11.3%* (7.2, 15.3) |
| Prior biologic failure+ | 0 | 6.5% | 6.5% | 1.1% | 9.2% | 8.1% |
| Without prior biologic failure+ | 2.6% | 15.4% | 12.8% | 2.4% | 17.9% | 15.5% |
Abbreviations: PBO = placebo; UPA = upadacitinib; aMS = adapted Mayo Score, based on the Mayo Scoring system (excluding Physician's Global Assessment), which ranged from 0 to 9 and has three subscores that were each scored 0 (normal) to 3 (most severe): stool frequency subscore (SFS), rectal bleeding subscore (RBS) and a centrally-reviewed endoscopy subscore (ES).
+ The number of "Prior biologic failure" patients in UC-1 and UC-2 are 78 and 89 in the placebo group, and 168 and 173 in the upadacitinib 45 mg group, respectively; the number of "Without prior biologic failure" patients in UC-1 and UC-2 are 76 and 85 in the placebo group, and 151 and 168 in the upadacitinib 45 mg group, respectively.
* p<0.001, adjusted treatment difference (95% CI)
a Per aMS: SFS≤ 1 and not greater than baseline, RBS = 0, ES ≤ 1 without friability
b Per aMS: decrease ≥2 points and ≥30% from baseline and a decrease in RBS ≥ 1 from baseline or an absolute RBS ≤1.
c ES ≤1 without friability
d ES ≤1 without friability and Geboes score ≤3.1 (indicating neutrophil infiltration in <5% of crypts, no crypt destruction, and no erosions, ulcerations, or granulation tissue.)
e ES = 0, Geboes score <2 (indicating no neutrophil in crypts or lamina propria and no increase in eosinophil, no crypt destruction, and no erosions, ulcerations, or granulation tissue)
Disease activity and symptoms:
The partial adapted Mayo score (paMS) is composed of SFS and RBS. Symptomatic response per paMS is defined as a decrease of ≥1 point and ≥30% from baseline and a decrease in RBS ≥1 or an absolute RBS ≤1. Statistically significant improvement compared to placebo per paMS was seen as early as week 2 (UC-1: 60.1% vs 27.3% and UC-2: 63.3% vs 25.9%).
Extended induction:
A total of 125 patients in UC-1 and UC-2 who did not achieve clinical response after 8 weeks of treatment with upadacitinib 45 mg once daily entered an 8-week open-label extended induction period. After the treatment of an additional 8 weeks (16 weeks total) of upadacitinib 45 mg once daily, 48.3% of patients achieved clinical response per aMS. Among patients who responded to treatment of 16-week upadacitinib 45 mg once daily, 35.7% and 66.7% of patients maintained clinical response per aMS and 19.0% and 33.3% of patients achieved clinical remission per aMS at week 52 with maintenance treatment of upadacitinib 15 mg and 30 mg once daily, respectively.
Maintenance study (UC-3)
The efficacy analysis for UC-3 was evaluated in 451 patients who achieved clinical response per aMS with 8-week upadacitinib 45 mg once daily induction treatment. Patients were randomised to receive upadacitinib 15 mg, 30 mg or placebo once daily for up to 52 weeks.
The primary endpoint was clinical remission per aMS at week 52. Table 16 shows the key secondary endpoints including maintenance of clinical remission, corticosteroid-free clinical remission, mucosal healing, histologic-endoscopic mucosal healing and deep mucosal healing.
Table 16. Proportion of patients meeting primary and key secondary efficacy endpoints at week 52 in the maintenance study UC-3:
| PBO N=149 | UPA 15 mg N=148 | UPA 30 mg N=154 | Treatment Difference 15 mg vs PBO (95% CI) | Treatment Difference 30 mg vs PBO (95% CI) | |
|---|---|---|---|---|---|
| Clinical remissiona | 12.1% | 42.3% | 51.7% | 30.7%* (21.7, 39.8) | 39.0%* (29.7, 48.2) |
| Prior biologic failure+ | 7.5% | 40.5% | 49.1% | 33.0% | 41.6% |
| Without prior biologic failure+ | 17.6% | 43.9% | 54.0% | 26.3% | 36.3% |
| Maintenance of clinical remissionb | N=54 22.2% | N=47 59.2% | N=58 69.7% | 37.4%* (20.3, 54.6) | 47.0%* (30.7, 63.3) |
| Prior biologic failure | N=22 13.6% | N=17 76.5% | N=20 73.0% | 62.8% | 59.4% |
| Without prior biologic failure | N=32 28.1% | N=30 49.4% | N=38 68.0% | 21.3% | 39.9% |
| Corticosteroid-free clinical remissionc | N=54 22.2% | N=47 57.1% | N=58 68.0% | 35.4%* (18.2, 52.7) | 45.1%* (28.7, 61.6) |
| Prior biologic failure | N=22 13.6% | N=17 70.6% | N=20 73.0% | 57.0% | 59.4% |
| Without prior biologic failure | N=32 28.1% | N=30 49.4% | N=38 65.4% | 21.3% | 37.2% |
| Mucosal healingd | 14.5% | 48.7% | 61.6% | 34.4%* (25.1, 43.7) | 46.3%* (36.7, 55.8) |
| Prior biologic failure+ | 7.8% | 43.3% | 56.1% | 35.5% | 48.3% |
| Without prior biologic failure+ | 22.5% | 53.6% | 66.6% | 31.1% | 44.1% |
| Histologic-endoscopic mucosal healinge | 11.9% | 35.0% | 49.8% | 23.8%* (14.8, 32.8) | 37.3%* (27.8, 46.8) |
| Prior biologic failure+ | 5.2% | 32.9% | 47.6% | 27.7% | 42.4% |
| Without prior biologic failure+ | 20.0% | 36.9% | 51.8% | 16.9% | 31.8% |
| Deep mucosal healingf | 4.7% | 17.6% | 19.0% | 13.0%* (6.0, 20.0) | 13.6%* (6.6, 20.6) |
| Prior biologic failure+ | 2.5% | 17.2% | 16.1% | 14.7% | 13.6% |
| Without prior biologic failure+ | 7.5% | 18.0% | 21.6% | 10.6% | 14.2% |
Abbreviations: PBO = placebo; UPA = upadacitinib; aMS = adapted Mayo Score, based on the Mayo Scoring system (excluding Physician's Global Assessment), which ranged from 0 to 9 and has three subscores that were each scored 0 (normal) to 3 (most severe): stool frequency subscore (SFS), rectal blee ding subscore (RBS) and a centrally-reviewed endoscopy subscore (ES).
+ The number of "Prior biologic failure" patients are 81, 71, and 73 in the placebo, upadacitinib 15 mg, and 30 mg group, respectively. The number of "Without prior biologic failure" patients are 68, 77, and 81 in the placebo, upadacitinib 15 mg, and 30 mg group, respectively.
* p<0.001, adjusted treatment difference (95% CI)
a Per aMS: SFS≤ 1 and not greater than baseline, RBS = 0, ES ≤ 1 without friability
b Clinical remission per aMS at Week 52 among patients who achieved clinical remission at the end of induction treatment.
c Clinical remission per aMS at Week 52 and corticosteroid-free for ≥90 days immediately preceding Week 52 among patients who achieved clinical remission at the end of the induction treatment.
d ES ≤1 without friability
e ES ≤1 without friability and Geboes score ≤3.1 (indicating neutrophil infiltration in <5% of crypts, no crypt destruction and no erosions, ulcerations or granulation tissue).
f ES = 0, Geboes score <2 (indicating no neutrophil in crypts or lamina propria and no increase in eosinophil, no crypt destruction, and no erosions, ulcerations or granulation tissue).
Disease symptoms:
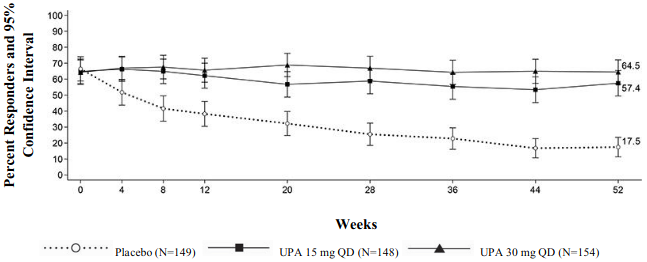
Symptomatic remission per paMS, defined as SFS ≤ 1 and RBS = 0, was achieved over time through week 52 in more patients treated with both upadacitinib 15 mg and 30 mg once daily compared with placebo (Figure 2).
Figure 2. Proportion of patients with symptomatic remission per partial adapted Mayo score over time in maintenance study UC-3:
Endoscopic assessment:
Endoscopic remission (normalisation of the endoscopic appearance of the mucosa) was defined as ES of 0. At week 8, a significantly greater proportion of patients treated with upadacitinib 45 mg once daily compared to placebo achieved endoscopic remission (UC-1: 13.7% vs 1.3%, UC-2: 18.2% vs 1.7%). In UC-3, a significantly greater proportion of patients treated with upadacitinib 15 mg and 30 mg once daily compared to placebo achieved endoscopic remission at week 52 (24.2% and 25.9% vs 5.6%). Maintenance of mucosal healing at week 52 (ES ≤1 without friability) was seen in a significantly greater proportion of patients treated with upadacitinib 15 mg and 30 mg once daily compared to placebo (61.6% and 69.5% vs 19.2%) among patients who achieved mucosal healing at the end of induction.
Quality of life:
Patients treated with upadacitinib demonstrated significantly greater and clinically meaningful improvement in health-related quality of life measured by the Inflammatory Bowel Disease Questionnaire (IBDQ) total score compared to placebo. Improvements were seen in all 4 domain scores: systemic symptoms (including fatigue), social function, emotional function and bowel symptoms (including abdominal pain and bowel urgency). Changes in IBDQ total score at week 8 from baseline with upadacitinib 45 mg once daily compared to placebo were 55.3 and 21.7 in UC-1 and 52.2 and 21.1 in UC-2, respectively. Changes in IBDQ total score at week 52 from baseline were 49.2, 58.9 and 17.9 in patients treated with upadacitinib 15 mg, 30 mg once daily and placebo, respectively.
Long-term extension study (UC-4):
Patients who achieved clinical remission in UC-3 per aMS at 1 year were eligible to continue with the same dose in the extension study (UC-4). At the entry of UC-4, there were 96 and 146 patients in clinical remission and 49 and 82 patients in endoscopic remission with upadacitinib 15 mg and 30 mg, respectively. This population is partly, but not fully, overlapping with the population presented in the above table depicting proportion of patients meeting endpoints at week 52 in the maintenance study UC-3. Among patients who achieved remission in UC-3 per aMS at 1 year and had available 96 weeks data, 55/70 (78.6%) and 75/89 (84.3%) maintained clinical remission and 22/34 (64.7%) and 40/54 (74.1%) maintained endoscopic remission after 96 weeks of additional treatment with upadacitinib 15 mg and 30 mg, respectively.
In patients entering the extension study upon completion of UC-3 (1 year) and had available 96 weeks data, improvements in IBDQ total scores and in IBDQ domain scores were maintained through week 96 of UC-4.
The safety profile of upadacitinib with long-term treatment was consistent with that in the placebo-controlled period.
Crohn's disease
The efficacy and safety of upadacitinib was evaluated in three multicenter, double-blind, placebo-controlled Phase 3 studies: two induction studies, CD-1 (U-EXCEED) and CD-2 (U-EXCEL), followed by a 52-week maintenance treatment and long-term extension study, CD-3 (U-ENDURE). The co-primary endpoints were clinical remission and endoscopic response at week 12 for CD-1 and CD-2, and at week 52 for CD-3.
Enrolled patients were 18 to 75 years of age with moderately to severely active Crohn's disease (CD), defined as an average daily very soft or liquid stool frequency (SF) ≥ 4 and/or average daily abdominal pain score (APS) ≥ 2, and a centrally-reviewed Simple Endoscopic Score for CD (SES-CD) of ≥ 6, or ≥ 4 for isolated ileal disease, excluding the narrowing component. Patients with symptomatic bowel strictures were excluded from CD studies.
Induction studies (CD-1 and CD-2)
In CD-1 and CD-2, 1021 patients (495 and 526 patients, respectively) were randomised to upadacitinib 45 mg once daily or placebo for 12 weeks with a 2:1 treatment allocation ratio.
In CD-1, all patients had inadequate response or were intolerant to treatment with one or more biologic therapies (prior biologic failure). Of these patients, 61% (301/495) had inadequate response or were intolerant to two or more biologic therapies.
In CD-2, 45% (239/526) patients had an inadequate response or were intolerant to treatment with one or more biologic therapies (prior biologic failure), and 55% (287/526) had an inadequate response or were intolerant to treatment with conventional therapies but not to biologic therapy (without prior biologic failure).
At baseline in CD-1 and CD-2, 34% and 36% of patients received corticosteroids, 7% and 3% of patients received immunomodulators, and 15% and 25% of patients received aminosalicylates.
In both studies, patients receiving corticosteroids at baseline initiated a corticosteroid taper regimen starting at week 4.
Both studies included a 12-week extended treatment period with upadacitinib 30 mg once daily for patients who received upadacitinib 45 mg once daily and did not achieve clinical response per SF/APS (≥30% decrease in average daily very soft or liquid SF and/or ≥30% decrease in average daily APS and neither greater than baseline) at week 12.
Clinical disease activity and symptoms:
In CD-1 and CD-2, a significantly greater proportion of patients treated with upadacitinib 45 mg achieved the co-primary endpoint of clinical remission at week 12 compared to placebo (Table 17). Onset of efficacy was rapid and achieved as early as week 2 (Table 17).
In both studies, patients receiving upadacitinib 45 mg experienced significantly greater improvement from baseline in fatigue, as measured by FACIT-F score at week 12 compared to placebo.
Endoscopic assessment:
In CD-1 and CD-2, a significantly greater proportion of patients treated with upadacitinib 45 mg achieved the co-primary endpoint of endoscopic response at week 12 compared to placebo (Table 17). In CD-1 and CD-2, a greater proportion of patients treated with upadacitinib 45 mg (14% and 19%, respectively) compared to placebo (0% and 5%, respectively) achieved SES-CD 0-2.
Table 17. Proportion of patients meeting primary and additional efficacy endpoints in induction studies CD-1 and CD-2:
| Study | CD-1 (U-EXCEED) | CD-2 (U-EXCEL) | ||||
|---|---|---|---|---|---|---|
| Treatment Group | PBO N=171 | UPA 45 mg N=324 | Treatment Difference (95% CI) | PBO N=176 | UPA 45 mg N=350 | Treatment Difference (95% CI) |
| Co-Primary Endpoints at Week 12 | ||||||
| Clinical remissiona | 14% | 40% | 26% (19, 33)* | 22% | 51% | 29% (21, 36)* |
| Prior biologic failure | N=78 14% | N=161 47% | 33% (22, 44) | |||
| Without prior biologic failure | N=98 29% | N=189 54% | 26% (14, 37) | |||
| Endoscopic responseb | 4% | 35% | 31% (25, 37)* | 13% | 46% | 33% (26, 40)* |
| Prior biologic failure | N=78 9% | N=161 38% | 29% (19, 39) | |||
| Without prior biologic failure | N=98 16% | N=189 52% | 36% (25, 46) | |||
| Additional Endpoints at Week 12 | ||||||
| Clinical remission per CDAIc | 21% | 39% | 18% (10, 26)* | 29% | 49% | 21% (13, 29)* |
| Clinical response (CR-100)d | 27% | 51% | 23% (14, 31)* | 37% | 57% | 20% (11, 28)* |
| Corticosteroid-free clinical remissiona,e | N=60 7% | N=108 37% | 30% (19, 41)* | N=64 13% | N=126 44% | 33% (22, 44)* |
| Endoscopic remissionf | 2% | 19% | 17% (12, 22)* | 7% | 29% | 22% (16, 28)* |
| Mucosal healingg | N=171 0% | N=322 17% | 17% (13, 21)*** | N=174 5% | N=349 25% | 20% (14, 25)*** |
| Early Onset Endpoints | ||||||
| Clinical remission at Week 4a | 9% | 32% | 23% (17, 30)* | 15% | 36% | 21% (14, 28)* |
| CR-100 at Week 2d | 12% | 33% | 21% (14, 28)* | 20% | 32% | 12% (4, 19)** |
Abbreviation: PBO = placebo, UPA = upadacitinib
* p<0.001, adjusted treatment difference (95% CI)
** p<0.01, adjusted treatment difference (95% CI)
*** nominal p<0.001 UPA vs PBO comparison, adjusted treatment difference (95% CI)
a Average daily SF ≤2.8 and APS ≤1.0 and neither greater than baseline
b Decrease in SES-CD >50% from baseline of the induction study (or for patients with an SES-CD of 4 at baseline of the induction study, at least a 2-point reduction from baseline of the induction study)
c CDAI <150
d Decrease of at least 100 points in CDAI from baseline
e Discontinuation of steroid and achievement of clinical remission among patients on steroid at baseline
f SES-CD ≤4 and at least a 2-point reduction versus baseline and no subscore >1 in any individual variable
g SES-CD ulcerated surface subscore of 0 in patients with SES-CD ulcerated surface subscore ≥1 at baseline
Maintenance study (CD-3)
The efficacy analysis for CD-3 evaluated 502 patients who achieved clinical response per SF/APS with the 12-week upadacitinib 45 mg once daily induction treatment. Patients were re-randomised to receive a maintenance regimen of either upadacitinib 15 mg or 30 mg once daily or placebo for 52 weeks.
Clinical disease activity and symptoms:
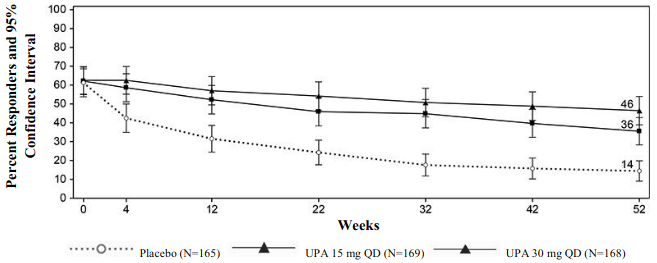
A significantly greater proportion of patients treated with upadacitinib 15 mg and 30 mg achieved the co-primary endpoint of clinical remission at week 52 compared to placebo (Figure 3, Table 18).
Figure 3. Proportion of patients achieving clinical remission in maintenance study CD-3:
Patients receiving upadacitinib 30 mg experienced significantly greater improvement from baseline in fatigue, as measured by FACIT-F score at week 52 compared to placebo.
Table 18. Proportion of patients meeting primary and additional efficacy endpoints at week 52 in maintenance study CD-3:
| Treatment Group | PBO+ N=165 | UPA 15 mg N=169 | UPA 30 mg N=168 | Treatment Difference 15 mg vs PBO (95% CI) | Treatment Difference 30 mg vs PBO (95% CI) | |
|---|---|---|---|---|---|---|
| Co-Primary Endpoints | ||||||
| Clinical remissiona | 14% | 36% | 46% | 22% (14, 30)* | 32% (23, 40)* | |
| Prior biologic failure | N=126 9% | N=124 32% | N=127 43% | 24% (14, 33) | 34% (24, 44) | |
| Without prior biologic failure | N=39 33% | N=45 44% | N=41 59% | 12% (-9, 33) | 26% (5, 47) | |
| Endoscopic responseb | 7% | 28% | 40% | 21% (14, 28)* | 34% (26, 41)* | |
| Prior biologic failure | N=126 4% | N=124 23% | N=127 39% | 19% (11, 27) | 35% (26, 44) | |
| Without prior biologic failure | N=39 18% | N=45 40% | N=41 44% | 22% (3, 41) | 26% (7, 45) | |
| Additional Endpoints | ||||||
| Clinical remission per CDAIc | 15% | 37% | 48% | 24% (15, 32)* | 33% (24, 42)* | |
| Clinical response (CR-100)d | 15% | 41% | 51% | 27% (18, 36)* | 36% (28, 45)* | |
| Corticosteroid-free clinical remissiona,e | 14% | 35% | 45% | 21% (13, 30)* | 30% (21, 39)* | |
| Maintenance of clinical remissiona,f | N=101 20% | N=105 50% | N=105 60% | 32% (20, 44)* | 40% (28, 52)* | |
| Endoscopic remissiong | 5% | 19% | 29% | 14% (8, 21)* | 24% (16, 31)* | |
| Mucosal healingh | N=164 4% | N=167 13% | N=168 24% | 10% (4, 16)*** | 21% (14, 27)*** | |
| Deep remissiona,i | 4% | 14% | 23% | 10% (4, 16)** | 18% (11, 25)* | |
Abbreviation: PBO = placebo, UPA = upadacitinib
+ The placebo group consisted of patients who achieved clinical response per SF/APS with upadacitinib 45 mg at the end of the induction study and were randomised to receive placebo at the start of maintenance therapy
* p<0.001, adjusted treatment difference (95% CI)
** p<0.01, adjusted treatment difference (95% CI)
*** nominal p<0.001 UPA vs PBO comparison, adjusted treatment difference (95% CI)
a Average daily SF ≤2.8 and APS ≤1.0 and neither greater than baseline
b Decrease in SES-CD >50% from baseline of the induction study (or for patients with an SES-CD of 4 at baseline of the induction study, at least a 2-point reduction from baseline of the induction study)
c CDAI <150
d Reduction of CDAI ≥100 points from baseline
e Corticosteroid-free for 90 days prior to week 52 and achievement of clinical remission. Among the subset of patients who were on corticosteroids at induction baseline, 38% (N=63) in upadacitinib 15 mg group, 38% (N=63) in upadacitinib 30 mg group, and 5% (N=61) in placebo were corticosteroid-free for 90 days prior to week 52 and in clinical remission
f Defined as achievement of clinical remission at Week 52 in patients who achieved clinical remission at the entry of the maintenance study
g SES-CD ≤4 and at least a 2-point reduction versus baseline and no subscore >1 in any individual variable
h SES-CD ulcerated surface subscore of 0 in patients with SES-CD ulcerated surface subscore ≥1 at baseline
i Clinical remission and endoscopic remission
Patients who were not in clinical response per SF/APS to upadacitinib induction at week 12 in CD-1 and CD-2 (122 patients) received upadacitinib 30 mg once daily for an additional 12 weeks. Of these patients, 53% achieved clinical response at week 24. Of the patients who responded to the extended treatment period and continued to receive maintenance treatment with upadacitinib 30 mg, 25% achieved clinical remission and 22% achieved endoscopic response at week 52.
Endoscopic assessment:
In CD-3, a significantly greater proportion of patients treated with upadacitinib 15 mg and 30 mg achieved the co-primary endpoint of endoscopic response at week 52 compared to placebo (Table 17). In addition to the endoscopic endpoints described in Table 17, a greater proportion of patients treated with upadacitinib 15 mg and 30 mg (11% and 21%, respectively) compared to placebo (3%) achieved SES-CD 0-2 at week 52. Corticosteroid-free endoscopic remission among patients on steroid at baseline was achieved in a greater proportion of patients treated with upadacitinib 15 mg and 30 mg (17% and 25%, respectively) compared to placebo (3%) at week 52.
Resolution of extra-intestinal manifestations:
Resolution of extra-intestinal manifestations was observed in a greater proportion of patients treated with upadacitinib 15 mg (25%) and a significantly greater proportion of patients treated with upadacitinib 30 mg (36%) compared to placebo (15%) at week 52.
Rescue treatment:
In CD-3, patients who demonstrated inadequate response or lost response during maintenance were eligible to receive rescue treatment with upadacitinib 30 mg. Of the patients who were randomised to upadacitinib 15 mg group and received rescue treatment of upadacitinib 30 mg for at least 12 weeks, 84% (76/90) achieved clinical response per SF/APS and 48% (43/90) achieved clinical remission 12 weeks after initiating rescue.
Health-related quality of life outcomes:
Patients treated with upadacitinib achieved greater improvement in health-related quality of life (HRQOL) measured by the Inflammatory Bowel Disease Questionnaire (IBDQ) total score compared to placebo. Improvements were seen in all 4 domain scores: systemic symptoms (including fatigue) and bowel symptoms (including abdominal pain and bowel urgency), as well as social and emotional functioning. Changes from baseline in IBDQ total score at week 12 with upadacitinib 45 mg once daily compared to placebo were 46.0 and 21.6 in CD-1 and 46.3 and 24.4 in CD-2, respectively. Changes in IBDQ total score at week 52 from baseline were 59.3, 64.5 and 46.4 in patients treated with upadacitinib 15 mg, 30 mg once daily and placebo, respectively.
Paediatric population
A total of 542 adolescents aged 12 to 17 years with moderate to severe atopic dermatitis were randomised across the three global Phase 3 studies, of which 344 were evaluated for the primary analysis. Adolescents in the primary analysis were randomised to receive either 15 mg (N=114) or 30 mg (N=114) upadacitinib or matching placebo (N=116), in monotherapy or combination with topical corticosteroids. Efficacy was consistent between the adolescents and adults. The safety profile in adolescents was generally similar to that in adults, with dose-dependent increases in the rate of some adverse events, including neutropenia and herpes zoster. At both doses, the rate of neutropenia was slightly increased in adolescents compared to adults. At both doses, the rate of herpes zoster was higher in adults compared to that in adolescents.
Table 19. Efficacy results of upadacitinib for adolescents at week 16:
| Study | MEASURE UP 1 | MEASURE UP 2 | AD UP | ||||||
|---|---|---|---|---|---|---|---|---|---|
| Treatment Group | PBO | UPA 15 mg | UPA 30 mg | PBO | UPA 15 mg | UPA 30 mg | PBO + TCS | UPA 15 mg + TCS | UPA 30 mg + TCS |
| Number of adolescent subjects randomised | 40 | 42 | 42 | 36 | 33 | 35 | 40 | 39 | 37 |
| % responders (95% CI) | |||||||||
| vIGA-AD 0/1a,b | 8 (0,16) | 38 (23,53) | 69 (55,83) | 3 (0,8) | 42 (26,59) | 62 (46,79) | 8 (0,16) | 31 (16,45) | 65 (50,80) |
| EASI 75a | 8 (0,17) | 71 (58,85) | 83 (72,95) | 14 (3,25) | 67 (51,83) | 74 (59,90) | 30 (16,44) | 56 (41,72) | 76 (62,90) |
| Worst Pruritus NRSc (≥ 4-point improvement) | 15 (4,27) | 45 (30,60) | 55 (40,70) | 3 (0,8) | 33 (16,50) | 50 (33,67) | 13 (2,24) | 42 (26,58) | 55 (38,72) |
Abbreviations: UPA = upadacitinib (RINVOQ); PBO = placebo
Subjects with rescue medication or with missing data were counted as non-responders.
a Based on number of subjects randomised
b Responder was defined as a patient with vIGA-AD 0 or 1 ("clear" or "almost clear") with a reduction of ≥ 2 points on a 0-4 ordinal scale.
c Results shown in subset of patients eligible for assessment (patients with Worst Pruritus NRS ≥ 4 at baseline).
The European Medicines Agency has deferred the obligation to submit the results of studies with RINVOQ in one or more subsets of the paediatric population in chronic idiopathic arthritis (including rheumatoid arthritis, psoriatic arthritis, spondyloarthritis and juvenile idiopathic arthritis) atopic dermatitis, ulcerative colitis, and Crohn's disease (see section 4.2 for information on paediatric use).
5.2. Pharmacokinetic properties
Upadacitinib plasma exposures are proportional to dose over the therapeutic dose range. Steady-state plasma concentrations are achieved within 4 days with minimal accumulation after multiple once daily administrations.
Absorption
Following oral administration of upadacitinib prolonged-release formulation, upadacitinib is absorbed with a median Tmax of 2 to 4 hours. Coadministration of upadacitinib with a high-fat meal had no clinically relevant effect on upadacitinib exposures (increased AUC by 29% and Cmax by 39% to 60%). In clinical trials, upadacitinib was administered without regard to meals (see section 4.2). In vitro, upadacitinib is a substrate for the efflux transporters P-gp and BCRP.
Distribution
Upadacitinib is 52% bound to plasma proteins. Upadacitinib partitions similarly between plasma and blood cellular components, as indicated by the blood to plasma ratio of 1.0.
Metabolism
Upadacitinib metabolism is mediated by CYP3A4 with a potential minor contribution from CYP2D6. The pharmacologic activity of upadacitinib is attributed to the parent molecule. In a human radiolabeled study, unchanged upadacitinib accounted for 79% of the total radioactivity in plasma while the main metabolite (product of monooxidation followed by glucuronidation) accounted for 13% of the total plasma radioactivity. No active metabolites have been identified for upadacitinib.
Elimination
Following single dose administration of [14C]-upadacitinib immediate-release solution, upadacitinib was eliminated predominantly as the unchanged parent substance in urine (24%) and faeces (38%). Approximately 34% of upadacitinib dose was excreted as metabolites. Upadacitinib mean terminal elimination half-life ranged from 9 to 14 hours.
Special populations
Renal impairment
Upadacitinib AUC was 18%, 33%, and 44% higher in subjects with mild (estimated glomerular filtration rate 60 to 89 ml/min/1.73 m²), moderate (estimated glomerular filtration rate 30 to 59 ml/min/1.73 m²), and severe (estimated glomerular filtration rate 15 to 29 ml/min/1.73 m²) renal impairment, respectively, compared to subjects with normal renal function. Upadacitinib Cmax was similar in subjects with normal and impaired renal function. Mild or moderate renal impairment has no clinically relevant effect on upadacitinib exposure (see section 4.2).
Hepatic impairment
Mild (Child-Pugh A) and moderate (Child-Pugh B) hepatic impairment has no clinically relevant effect on upadacitinib exposure. Upadacitinib AUC was 28% and 24% higher in subjects with mild and moderate hepatic impairment, respectively, compared to subjects with normal liver function. Upadacitinib Cmax was unchanged in subjects with mild hepatic impairment and 43% higher in subjects with moderate hepatic impairment compared to subjects with normal liver function. Upadacitinib was not studied in patients with severe (Child-Pugh C) hepatic impairment.
Paediatric population
The pharmacokinetics of upadacitinib have not yet been evaluated in paediatric patients with rheumatoid arthritis, psoriatic arthritis, axial spondyloarthritis, ulcerative colitis, and Crohn's disease (see section 4.2).
Upadacitinib pharmacokinetics and steady-state concentrations are similar for adults and adolescents 12 to 17 years of age with atopic dermatitis. The posology in adolescent patients 30 kg to <40 kg was determined using population pharmacokinetic modelling and simulation. No clinical exposure data are available in adolescents <40 kg.
The pharmacokinetics of upadacitinib in paediatric patients (<12 years of age) with atopic dermatitis have not been established.
Intrinsic factors
Age, sex, body weight, race, and ethnicity did not have a clinically meaningful effect on upadacitinib exposure. Upadacitinib pharmacokinetics are consistent between rheumatoid arthritis, psoriatic arthritis, axial spondyloarthritis, giant cell arteritis, atopic dermatitis, ulcerative colitis, and Crohn's disease patients.
5.3. Preclinical safety data
Non-clinical data reveal no special hazard for humans based on conventional studies of safety pharmacology.
Upadacitinib, at exposures (based on AUC) approximately 4 and 10 times the clinical dose of 15 mg, 2 and 5 times the clinical dose of 30 mg, and 1.7 and 4 times the clinical dose of 45 mg in male and female Sprague-Dawley rats, respectively, was not carcinogenic in a 2-year carcinogenicity study in Sprague-Dawley rats. Upadacitinib was not carcinogenic in a 26-week carcinogenicity study in CByB6F1-Tg(HRAS)2Jic transgenic mice.
Upadacitinib was not mutagenic or genotoxic based on the results of in vitro and in vivo tests for gene mutations and chromosomal aberrations.
Upadacitinib had no effect on fertility in male or female rats at exposures up to approximately 17 and 34 times the maximum recommended human dose (MRHD) of 45 mg in males and females, respectively, on an AUC basis in a fertility and early embryonic development study. Dose-related increases in foetal resorptions associated with post-implantation losses in this fertility study in rats were attributed to the developmental/teratogenic effects of upadacitinib. No adverse effects were observed at exposures below clinical exposure (based on AUC). Post-implantation losses were observed at exposures 9 times the clinical exposure at the MRHD of 45 mg (based on AUC).
In animal embryo-foetal development studies, upadacitinib was teratogenic in both rats and rabbits. Upadacitinib resulted in increases in skeletal malformations in rats at 1.6, 0.8, and 0.6 times the clinical exposure (AUC-based) at the 15, 30, and 45 mg (MRHD) doses, respectively. In rabbits an increased incidence of cardiovascular malformations was observed at 15, 7.6, and 6 times the clinical exposure at the 15, 30, and 45 mg doses (AUC-based), respectively.
Following administration of upadacitinib to lactating rats, the concentrations of upadacitinib in milk over time generally paralleled those in plasma, with approximately 30-fold higher exposure in milk relative to maternal plasma. Approximately 97% of upadacitinib-related material in milk was the parent molecule, upadacitinib.
© All content on this website, including data entry, data processing, decision support tools, "RxReasoner" logo and graphics, is the intellectual property of RxReasoner and is protected by copyright laws. Unauthorized reproduction or distribution of any part of this content without explicit written permission from RxReasoner is strictly prohibited. Any third-party content used on this site is acknowledged and utilized under fair use principles.