TREMFYA Solution for injection Ref.[111726] Active ingredients: Guselkumab
Source: FDA, National Drug Code (US) Revision Year: 2024
12. Clinical Pharmacology
12.6 Immunogenicity
The observed incidence of anti-drug antibodies is highly dependent on the sensitivity and specificity of the assay. Differences in assay methods preclude meaningful comparisons of the incidence of anti-drug antibodies in the studies described below with the incidence of anti-drug antibodies in other studies, including those of guselkumab or of other guselkumab products.
Plaque Psoriasis
Up to Week 52, approximately 6% of subjects treated with TREMFYA developed antidrug antibodies. Of the subjects who developed antidrug antibodies, approximately 7% had antibodies that were classified as neutralizing antibodies. Among the 46 subjects who developed antibodies to guselkumab and had evaluable data, 21 subjects exhibited lower trough levels of guselkumab, including one subjects who experienced loss of efficacy after developing high antibody titers. Up to Week 156, approximately 9% of subjects treated with TREMFYA developed antidrug antibodies and of these subjects approximately 6% were classified as neutralizing antibodies. However, antibodies to guselkumab were generally not associated with changes in clinical response or development of injection-site reactions.
Psoriatic Arthritis
Up to Week 24, 2% (n=15) of subjects treated with TREMFYA developed antidrug antibodies. Of these subjects, 1 had antibodies that were classified as neutralizing antibodies. Overall, the small number of subjects who were positive for antibodies to guselkumab limits definitive conclusion of the effect of immunogenicity on the pharmacokinetics, efficacy and safety of guselkumab.
Ulcerative Colitis
Up to Week 56 in Studies UC1, UC2 and UC3, 11% (n=48) of subjects treated with TREMFYA at the recommended dosage developed antidrug antibodies. Of these subjects who tested positive for anti-guselkumab antibodies and were evaluable for neutralizing antibodies, 16% (n=6) had antibodies that were classified as neutralizing antibodies. Most of the subjects who were positive for antibodies to guselkumab had low titers. Two subjects with the highest antibody titers exhibited low trough levels of guselkumab. There was no identified clinically significant effect of antidrug antibodies on injection site reactions, or effectiveness of guselkumab, over the treatment duration of 56 weeks.
12.1. Mechanism of Action
Guselkumab is a human monoclonal IgG1λ antibody that selectively binds to the p19 subunit of interleukin 23 (IL-23) and inhibits its interaction with the IL-23 receptor. IL-23 is a naturally occurring cytokine that is involved in normal inflammatory and immune responses. Guselkumab inhibits the release of proinflammatory cytokines and chemokines.
12.2. Pharmacodynamics
In evaluated subjects with plaque psoriasis, guselkumab reduced serum levels of IL-17A, IL-17F and IL-22 relative to pre-treatment levels based on exploratory analyses of the pharmacodynamic markers.
In evaluated subjects with psoriatic arthritis, serum levels of acute phase proteins C-reactive protein, serum amyloid A and IL-6, and Th17 effector cytokines IL-17A, IL-17F and IL-22 were elevated at baseline. Serum levels of these proteins measured at Week 4 and Week 24 were decreased compared to baseline following guselkumab treatment at Week 0, Week 4 and every 8 weeks thereafter.
The relationship between these pharmacodynamic markers and the mechanism(s) by which guselkumab exerts its clinical effects is unknown.
12.3. Pharmacokinetics
Guselkumab exhibited linear pharmacokinetics in healthy subjects and subjects with plaque psoriasis following subcutaneous injections. In subjects with plaque psoriasis, following subcutaneous administration of 100 mg of TREMFYA at Weeks 0 and 4, and every 8 weeks thereafter, mean steady-state trough serum guselkumab concentration was approximately 1.2 mcg/mL.
The pharmacokinetics of guselkumab in subjects with psoriatic arthritis was similar to that in subjects with plaque psoriasis. Following subcutaneous administration of 100 mg of TREMFYA at Weeks 0, 4, and every 8 weeks thereafter, mean steady-state trough serum guselkumab concentration was approximately 1.2 mcg/mL.
Following subcutaneous maintenance dosing of 100 mg TREMFYA every 8 weeks or 200 mg TREMFYA every 4 weeks in subjects with ulcerative colitis, mean steady-state trough serum guselkumab concentrations were approximately 1.4 mcg/mL and 10.7 mcg/mL, respectively.
Distribution
In subjects with plaque psoriasis, apparent volume of distribution was 13.5 L. In subjects with ulcerative colitis, apparent volume of distribution at steady-state was 10.1 L.
Elimination
Apparent clearance in subjects with plaque psoriasis was 0.516 L/day. Mean half-life of guselkumab was approximately 15 to 18 days in subjects with plaque psoriasis across trials.
The apparent clearance in subjects with ulcerative colitis was 0.531 L/day. Mean half-life of guselkumab was approximately 17 days in subjects with ulcerative colitis.
Metabolism
The exact pathway through which guselkumab is metabolized has not been characterized. As a human IgG monoclonal antibody, guselkumab is expected to be degraded into small peptides and amino acids via catabolic pathways in the same manner as endogenous IgG.
Specific Populations
No apparent differences in clearance were observed in subjects ≥65 years of age compared to subjects <65 years of age, suggesting no dose adjustment is needed for elderly subjects. Clearance and volume of distribution of guselkumab increases as body weight increases, however, observed clinical trial data indicate that dose adjustment for body weight is not warranted. No specific trials have been conducted to determine the effect of renal or hepatic impairment on the pharmacokinetics of guselkumab.
Drug Interactions
Population pharmacokinetic analyses indicated that concomitant use of NSAIDs, oral corticosteroids and conventional DMARDs such as methotrexate (MTX), azathioprine (AZA), and 6-mercaptopurine (6-MP), did not affect the clearance of guselkumab.
Cytochrome P450 Substrates
The effects of guselkumab on the pharmacokinetics of midazolam (metabolized by CYP3A4), warfarin (metabolized by CYP2C9), omeprazole (metabolized by CYP2C19), dextromethorphan (metabolized by CYP2D6), and caffeine (metabolized by CYP1A2) were evaluated in an exploratory study with 6 to 12 evaluable subjects with moderate-to-severe plaque psoriasis. Changes in AUCinf of midazolam, S-warfarin, omeprazole, and caffeine after a single dose of guselkumab were not clinically relevant. For dextromethorphan, changes in AUC inf after guselkumab were not clinically relevant in 9 out of 10 subjects; however, a 2.9-fold change in AUCinf was observed in one individual [see Drug Interactions (7.1)].
Absorption
Following a single 100 mg subcutaneous injection in healthy subjects, guselkumab reached a mean (± SD) maximum serum concentration of 8.09 ± 3.68 mcg/mL by approximately 5.5 days post dose. The absolute bioavailability of guselkumab following a single 100 mg subcutaneous injection was estimated to be approximately 49% in healthy subjects.
Following the recommended intravenous induction dose regimen of TREMFYA 200 mg at Weeks 0, 4, and 8, mean (± SD) peak serum guselkumab concentration at Week 8 was 68.3 ± 17.3 mcg/mL in subjects with ulcerative colitis.
13.1. Carcinogenesis, Mutagenesis, Impairment of Fertility
Animal studies have not been conducted to evaluate the carcinogenic or mutagenic potential of TREMFYA.
No effects on fertility parameters were observed after male guinea pigs were subcutaneously administered guselkumab at a dose of 25 mg/kg twice weekly (6 times the exposure (AUC) in humans administered 200 mg intravenously and 10 times the exposure (AUC) at the 200 mg subcutaneous dose).
No effects on fertility parameters were observed after female guinea pigs were subcutaneously administered guselkumab at doses up to 100 mg/kg twice weekly (12 times the exposure (AUC) in humans administered 200 mg intravenously and 21 times the exposure (AUC) at the 200 mg subcutaneous dose).
14. Clinical Studies
14.1 Plaque Psoriasis
Four multicenter, randomized, double-blind trials (PsO1 [NCT02207231], PsO2 [NCT02207244], PsO3 [NCT02203032], and PsO4 [NCT02905331]) enrolled subjects 18 years of age and older with moderate-to-severe plaque psoriasis who were eligible for systemic therapy or phototherapy. Subjects had an Investigator’s Global Assessment (IGA) score of ≥3 (“moderate”) on a 5-point scale of overall disease severity, a Psoriasis Area and Severity Index (PASI) score ≥12, and a minimum affected body surface area (BSA) of 10%. Subjects with guttate, erythrodermic, or pustular psoriasis were excluded.
Trials PsO1 and PsO2
In PsO1 and PsO2, 1443 subjects were randomized to either TREMFYA (100 mg at Weeks 0 and 4 and every 8 weeks thereafter) administered with a prefilled syringe, placebo or U.S. licensed adalimumab (80 mg at Week 0 and 40 mg at Week 1, followed by 40 mg every other week thereafter).
Both trials assessed the responses at Week 16 compared to placebo for the two co-primary endpoints:
- the proportion of subjects who achieved an IGA score of 0 (“cleared”) or 1 (“minimal”);
- the proportion of subjects who achieved at least a 90% reduction from baseline in the PASI composite score (PASI 90).
Comparisons between TREMFYA and U.S. licensed adalimumab were secondary endpoints at the following time points:
- at Week 16 (PsO1 and PsO2), the proportions of subjects who achieved an IGA score of 0 or 1, a PASI 90, and a PASI 75 response;
- at Week 24 (PsO1 and PsO2), and at Week 48 (PsO1), the proportions of subjects achieving an IGA score of 0, an IGA score of 0 or 1, and a PASI 90 response.
Other evaluated outcomes included improvement in psoriasis symptoms assessed on the Psoriasis Symptoms and Signs Diary (PSSD) and improvements in psoriasis of the scalp at Week 16.
In both trials, subjects were predominantly men and white, with a mean age of 44 years and a mean weight of 90 kg. At baseline, subjects had a median affected BSA of approximately 21%, a median PASI score of 19, and 18% had a history of psoriatic arthritis. Approximately 24% of subjects had an IGA score of severe. In both trials, 23% had received prior biologic systemic therapy.
Clinical Response
Table 3 presents the efficacy results at Week 16 in PsO1 and PsO2.
Table 3. Efficacy Results at Week 16 in Adults with Plaque Psoriasis (NRI*):
| PsO1 | PsO2 | |||
|---|---|---|---|---|
| Endpoint | TREMFYA (N=329) n (%) | Placebo (N=174) n (%) | TREMFYA (N=496) n (%) | Placebo (N=248) n (%) |
| IGA response of 0/1†,‡ | 280 (85) | 12 (7) | 417 (84) | 21 (8) |
| PASI 90 response† | 241 (73) | 5 (3) | 347 (70) | 6 (2) |
* NRI = Non-Responder Imputation
† Co-Primary Endpoints
‡ IGA response of 0 (cleared) or 1 (minimal)
Table 4 presents the results of an analysis of all the North America sites (i.e., U.S. and Canada), demonstrating superiority of TREMFYA to U.S. licensed adalimumab.
Table 4. Efficacy Results in Adults with Plaque Psoriasis (NRI*):
| PsO1 | PsO2 | |||
|---|---|---|---|---|
| Endpoint | TREMFYA (N=115)† n (%) | Adalimumab‡ (N=115)† n (%) | TREMFYA (N=160)† n (%) | Adalimumab‡ (N=81)† n (%) |
| IGA response of 0/1 (cleared or minimal) | ||||
| Week 16 | 97 (84) | 70 (61) | 119 (74) | 50 (62) |
| Week 24 | 97 (84) | 62 (54) | 119 (74) | 46 (57) |
| Week 48 | 91 (79) | 62 (54) | NA | NA |
| IGA response of 0 (cleared) | ||||
| Week 24 | 61 (53) | 27 (23) | 76 (48) | 23 (28) |
| Week 48 | 54 (47) | 28 (24) | NA | NA |
| PASI 75 response | ||||
| Week 16 | 105 (91) | 80 (70) | 132 (83) | 51 (63) |
| PASI 90 response | ||||
| Week 16 | 84 (73) | 47 (41) | 102 (64) | 34 (42) |
| Week 24 | 92 (80) | 51 (44) | 113 (71) | 41 (51) |
| Week 48 | 84 (73) | 53 (46) | NA | NA |
* NRI = Non-Responder Imputation
† Subjects from sites in the United States and Canada
‡ U.S. licensed adalimumab
An improvement was seen in psoriasis involving the scalp in subjects randomized to TREMFYA compared to placebo at Week 16.
Examination of age, gender, race, body weight, and previous treatment with systemic or biologic agents did not identify differences in response to TREMFYA among these subgroups.
Maintenance and Durability of Response:
To evaluate maintenance and durability of response (PsO2), subjects randomized to TREMFYA at Week 0 and who were PASI 90 responders at Week 28 were re-randomized to either continue treatment with TREMFYA every 8 weeks or be withdrawn from therapy (i.e., receive placebo).
At Week 48, 89% of subjects who continued on TREMFYA maintained PASI 90 compared to 37% of subjects who were re-randomized to placebo and withdrawn from TREMFYA. For responders at Week 28 who were re-randomized to placebo and withdrawn from TREMFYA, the median time to loss of PASI 90 was approximately 15 weeks.
Patient Reported Outcomes:
Greater improvements in symptoms of psoriasis (itch, pain, stinging, burning and skin tightness) at Week 16 in TREMFYA compared to placebo were observed in both trials based on the Psoriasis Symptoms and Signs Diary (PSSD). Greater proportions of subjects on TREMFYA compared to U.S. licensed adalimumab achieved a PSSD symptom score of 0 (symptom-free) at Week 24 in both trials.
Trial PsO3
PsO3 [NCT02203032] evaluated the efficacy of 24 weeks of treatment with TREMFYA in subjects (N=268) who had not achieved an adequate response, defined as IGA ≥2 at Week 16 after initial treatment with U.S. licensed ustekinumab (dosed 45 mg or 90 mg according to the subject’s baseline weight at Week 0 and Week 4). These subjects were randomized to either continue with U.S. licensed ustekinumab treatment every 12 weeks or switch to TREMFYA 100 mg at Weeks 16, 20, and every 8 weeks thereafter. Baseline characteristics for randomized subjects were similar to those observed in PsO1 and PsO2.
In subjects with an inadequate response (IGA ≥2 at Week 16 to U.S. licensed ustekinumab), greater proportions of subjects on TREMFYA compared to U.S. licensed ustekinumab achieved an IGA score of 0 or 1 with a ≥2 grade improvement at Week 28 (31% vs. 14%, respectively; 12 weeks after randomization).
Trial PsO4
PsO4 [NCT02905331] evaluated the efficacy, safety, and pharmacokinetics of TREMFYA administered with the One-Press injector. In this study, 78 subjects were randomized to receive either TREMFYA (100 mg at Weeks 0 and 4 and every 8 weeks thereafter) [N=62], or placebo [N=16]. Baseline characteristics for subjects were comparable to those observed in PsO1 and PsO2. The co-primary endpoints were the same as those for PsO1 and PsO2. Secondary endpoints included the proportion of subjects who achieved an IGA score of 0 at Week 16 and the proportion of subjects who achieved a PASI 100 response at Week 16.
A greater proportion of subjects in the guselkumab group achieved an IGA score of 0 or 1 or a PASI 90 response at Week 16 (81% and 76%, respectively) than in the placebo group (0% for both endpoints). The proportion of subjects who achieved an IGA score of 0 at Week 16 was higher in the guselkumab group compared to the placebo group (56% vs. 0%). The proportion of subjects who achieved a PASI 100 response at Week 16 was higher in the guselkumab group compared to the placebo group (50% vs. 0%).
14.2 Psoriatic Arthritis
The safety and efficacy of TREMFYA were assessed in 1120 subjects in 2 randomized, double-blind, placebo-controlled trials (PsA1 [NCT03162796] and PsA2 [NCT03158285]) in adult subjects with active psoriatic arthritis (PsA) (≥3 swollen joints, ≥3 tender joints, and a C-reactive protein (CRP) level of ≥0.3 mg/dL in PsA1 and ≥5 swollen joints, ≥5 tender joints, and a CRP level of ≥0.6 mg/dL in PsA2) who had inadequate response to standard therapies (e.g., conventional DMARDs [cDMARDs]), apremilast, or nonsteroidal anti-inflammatory drugs [NSAIDs]). Subjects in these trials had a diagnosis of PsA for at least 6 months based on the Classification criteria for Psoriatic Arthritis (CASPAR) and a median duration of PsA of 4 years at baseline.
In PsA1 approximately 31% of subjects had been previously treated with up to 2 anti-tumor necrosis factor alpha (anti-TNFα) agents whereas in PsA2 all subjects were biologic naïve. Approximately 58% of subjects from both trials had concomitant methotrexate (MTX) use. Subjects with different subtypes of PsA were enrolled in both trials, including polyarticular arthritis with the absence of rheumatoid nodules (40%), spondylitis with peripheral arthritis (30%), asymmetric peripheral arthritis (23%), distal interphalangeal involvement (7%) and arthritis mutilans (1%). At baseline, over 65% and 42% of the subjects had enthesitis and dactylitis, respectively and 79% had ≥3% body surface area (BSA) psoriasis skin involvement.
PsA1 evaluated 381 subjects who were treated with placebo SC, TREMFYA 100 mg SC at Weeks 0, 4 and every 8 weeks (q8w) thereafter, or TREMFYA 100 mg SC every 4 weeks (q4w). PsA2 evaluated 739 subjects who were treated with placebo SC, TREMFYA 100 mg SC at Weeks 0, 4 and q8w thereafter, or TREMFYA 100 mg SC q4w. The primary endpoint in both trials was the percentage of subjects achieving an ACR20 response at Week 24.
Clinical Response
In both trials, subjects treated with TREMFYA 100 mg q8w demonstrated a greater clinical response including ACR20, compared to placebo at Week 24 (Tables 5 and 6). Similar responses were seen regardless of prior anti-TNFα exposure in PsA1, and in both trials similar responses were seen regardless of concomitant cDMARD use, previous treatment with cDMARDs, gender and body weight.
Table 5. Percent of Subjects with ACR Responses in PsA1:
| Placebo (N=126) | TREMFYA 100 mg q8w (N=127) | ||
|---|---|---|---|
| Response Rate | Response Rate | Difference from Placebo (95% CI) | |
| ACR 20 response* | |||
| Week 16 | 25% | 52% | 27 (15, 38) |
| Week 24 | 22% | 52% | 30 (19, 41) |
| ACR 50 response* | |||
| Week 16 | 13% | 23% | 10 (1, 19) |
| Week 24 | 9% | 30% | 21 (12, 31) |
| ACR 70 response* | |||
| Week 16 | 6% | 8% | 2 (-4, 8) |
| Week 24 | 6% | 12% | 6 (-0.3, 13) |
* Subjects with missing data at a visit were imputed as non-responders at that visit. Subjects who met escape criteria (less than 5% improvement in both tender and swollen joint counts) at Week 16 were allowed to initiate or increase the dose of the permitted concomitant medication and remained on the randomized group. Subjects who initiated or increased the dose of non-biologic DMARD or oral corticosteroids over baseline, discontinued study/study medication or initiated protocol prohibited medications/therapies for PsA prior to a visit were considered non-responders at that visit.
Table 6. Percent of Subjects with ACR Responses in PsA2:
| Placebo (N=246) | TREMFYA 100 mg q8w (N=248) | ||
|---|---|---|---|
| Response Rate | Response Rate | Difference fromTable 5 Placebo (95% CI) | |
| ACR 20 response* | |||
| Week 16 | 34% | 55% | 22 (13, 30) |
| Week 24 | 33% | 64% | 31 (23, 40) |
| ACR 50 response* | |||
| Week 16 | 9% | 29% | 19 (13, 26) |
| Week 24 | 14% | 32% | 17 (10, 24) |
| ACR 70 response* | |||
| Week 16 | 1% | 14% | 13 (9, 17) |
| Week 24 | 4% | 19% | 15 (9, 20) |
* Subjects with missing data at a visit were imputed as non-responders at that visit. Subjects who met escape criteria (less than 5% improvement in both tender and swollen joint counts) at Week 16 were allowed to initiate or increase the dose of the permitted concomitant medication and remained on the randomized group. Subjects who initiated or increased the dose of non-biologic DMARD or oral corticosteroids over baseline, discontinued study/study medication or initiated protocol prohibited medications/therapies for PsA prior to a visit were considered non-responders at that visit.
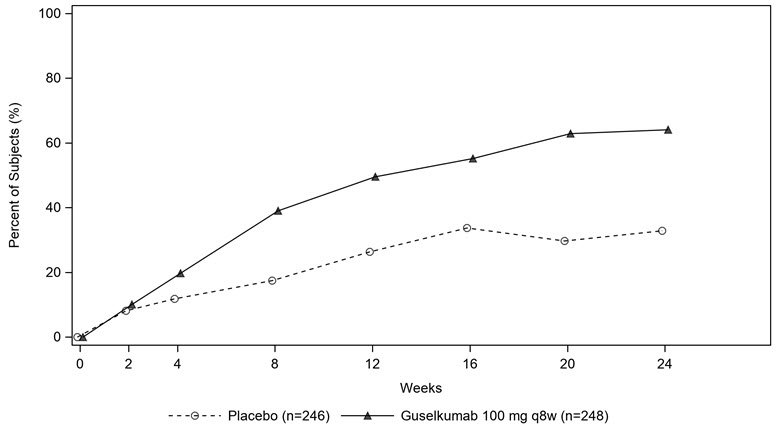
The percentage of subjects achieving ACR20 response in PsA2 by visit is shown in Figure 1.
Figure 1. Subjects Achieving ACR 20 Response by Visit Through Week 24 in PsA2
The results of the components of the ACR response criteria are shown in Table 7.
Table 7. Mean change (SD*) from Baseline in ACR Component Scores at Week 16 and 24 based on Observed Data:
| PsA1 | PsA2 | |||
|---|---|---|---|---|
| Placebo (N=126) | TREMFYA 100 mg q8w (N=127) | Placebo N=246 | TREMFYA 100 mg q8w (N=248) | |
| No. of Swollen Joints | ||||
| Baseline | 10.1 (7.1) | 10.9 (9.3) | 12.3 (6.9) | 11.7 (6.8) |
| Mean change at Week 16 | -4.2 (7.0) | -7.3 (7.0) | -5.8 (7.1) | -7.2 (6.0) |
| Mean change at Week 24 | -5.1 (6.9) | -7.3 (8.0) | -6.4 (7.2) | -8.1 (6.1) |
| No. of Tender Joints | ||||
| Baseline | 19.8 (14.4) | 20.2 (14.5) | 21.6 (13.1) | 19.8 (11.9) |
| Mean change at Week 16 | -4.5 (10.8) | -10.2 (10.4) | -6.8 (10.5) | -9.0 (9.4) |
| Mean change at Week 24 | -6.8 (13.0) | -10.5 (12.0) | -7.3 (11.2) | -10.4 (9.5) |
| Patient’s Assessment of Pain† | ||||
| Baseline | 5.8 (2.2) | 6.0 (2.1) | 6.3 (1.8) | 6.3 (2.0) |
| Mean change at Week 16 | -0.8 (2.3) | -1.7 (2.4) | -0.9 (2.3) | -2.2 (2.5) |
| Mean change at Week 24 | -0.7 (2.4) | -2.2 (2.6) | -1.1 (2.4) | -2.5 (2.5) |
| Patient Global Assessment† | ||||
| Baseline | 6.1 (2.2) | 6.5 (2.0) | 6.5 (1.8) | 6.5 (1.9) |
| Mean change at Week 16 | -1.0 (2.3) | -2.0 (2.6) | -1.0 (2.3) | -2.3 (2.6) |
| Mean change at Week 24 | -0.9 (2.5) | -2.5 (2.7) | -1.2 (2.6) | -2.5 (2.5) |
| Physician Global Assessment† | ||||
| Baseline | 6.3 (1.7) | 6.2 (1.7) | 6.7 (1.5) | 6.6 (1.6) |
| Mean change at Week 16 | -1.9 (2.2) | -2.9 (2.4) | -2.1 (2.2) | -3.5 (2.3) |
| Mean change at Week 24 | -2.2 (2.3) | -3.5 (2.4) | -2.5 (2.3) | -3.8 (2.3) |
| Disability Index (HAQ-DI)‡ | ||||
| Baseline | 1.2 (0.7) | 1.2 (0.6) | 1.3 (0.6) | 1.3 (0.6) |
| Mean change at Week 16 | -0.1 (0.5) | -0.3 (0.5) | -0.1 (0.5) | -0.3 (0.5) |
| Mean change at Week 24 | -0.1 (0.5) | -0.3 (0.6) | -0.2 (0.5) | -0.4 (0.5) |
| CRP (mg/dL) | ||||
| Baseline | 1.4 (1.9) | 1.6 (2.4) | 2.1 (2.7) | 2.0 (2.4) |
| Mean change at Week 16 | -0.2 (1.5) | -0.6 (2.2) | -0.6 (2.5) | -1.0 (2.2) |
| Mean change at Week 24 | -0.0 (2.8) | -0.7 (2.1) | -0.5 (2.5) | -1.1 (2.2) |
* SD = standard deviation
† Assessment based on Visual Analog Scale (cm) with the left end indicating “no pain” (for patient’s assessment of pain), “very well” (for patient global assessment), or “no arthritis activity” (for physician global assessment) and the right end indicating “the worst possible pain” (for patient assessment of pain), “poor” (for patient global assessment), or "extremely active arthritis (for physician global assessment).
‡ Disability Index of the Health Assessment Questionnaire; 0 = no difficulty to 3 = inability to perform, measures the patient’s ability to perform the following: dressing, arising, eating, walking, hygiene, reaching, gripping, and activities of daily living.
Treatment with TREMFYA resulted in an improvement in the skin manifestations of psoriasis in subjects with PsA.
Treatment with TREMFYA resulted in improvement in dactylitis and enthesitis in subjects with pre-existing dactylitis or enthesitis.
Physical Function:
TREMFYA treated subjects in the TREMFYA 100 mg q8w group in both PsA1 and PsA2 showed greater mean improvement from baseline in physical function compared to subjects treated with placebo as assessed by the Health Assessment Questionnaire-Disability Index (HAQ-DI) at Weeks 16 and 24. In both studies, the proportion of HAQ-DI responders (≥0.35 improvement in HAQ-DI score) was greater in the TREMFYA q8w dose group compared to placebo at Weeks 16 and 24.
Other Health-Related Outcomes:
General health status was assessed by the Short Form health survey (SF-36). At Week 24, subjects in the TREMFYA 100 mg q8w dose group in both PsA1 and PsA2 showed greater improvement from baseline in the SF-36 physical component summary (PCS) compared with placebo. There was not a statistically significant improvement observed in the SF-36 MCS. At Week 24, there was numerical improvement in the physical functioning, role-physical, bodily-pain, general health, social-functioning and vitality domains but not in the role-emotional and mental health domains. Fatigue was assessed by the Functional Assessment of Chronic Illness Therapy-Fatigue score (FACIT-F) in Studies PsA1 and PsA2. Treatment with TREMFYA resulted in improvement in fatigue as measured by FACIT-F.
14.3 Ulcerative Colitis
Induction Trial: UC1
In the 12-week induction study (UC1; NCT04033445), 701 subjects with moderately to severely active ulcerative colitis were randomized 3:2 to receive either TREMFYA 200 mg or placebo by intravenous infusion at Week 0, Week 4, and Week 8. Disease activity was assessed by the modified Mayo score (mMS), a 3-component Mayo score (0–9) which consists of the following subscores (0 to 3 for each subscore): stool frequency (SFS), rectal bleeding (RBS), and findings on centrally reviewed endoscopy (ES). An ES of 2 was defined by marked erythema, lack of vascular pattern, friability, and/or erosions; an ES of 3 was defined by spontaneous bleeding and ulceration. Enrolled subjects with a mMS between 5 and 9 and an ES of 2 or 3 were classified as having moderately to severely active ulcerative colitis. Subjects with inadequate response, loss of response, or intolerance to corticosteroids, immunomodulators (azathioprine, 6-mercaptopurine), biologic therapy (TNF blockers, vedolizumab), and/or Janus kinase (JAK) inhibitors were enrolled.
At baseline in UC1, the median mMS was 7, 64% of subjects had severely active disease (mMS ≥7), and 68% of subjects had an ES of 3. In UC1, 49% of subjects had previously failed (inadequate response, loss of response, or intolerance) treatment with at least one biologic therapy and/or JAK inhibitor, 48% were biologic and JAK inhibitor naïve, and 3% had previously received but not failed a biologic or JAK inhibitor. The median age was 39 years (ranging from 18 to 79 years); 43% were female; and 72% identified as White, 21% as Asian, 1% as Black or African American, <1% as American Indian or Alaskan Native, and <1% as multiple racial groups. Enrolled subjects were permitted to use stable doses of oral aminosalicylates, immunomodulators (azathioprine, 6-mercaptopurine, methotrexate), and/or oral corticosteroids (up to 20 mg/day prednisone or equivalent). At baseline, 72% of subjects were receiving aminosalicylates, 21% of subjects were receiving immunomodulators, and 43% of subjects were receiving corticosteroids. Concomitant biologic therapies or JAK inhibitors were not permitted.
In UC1, the primary endpoint was clinical remission at Week 12 as defined by the mMS. Secondary endpoints at Week 12 included endoscopic improvement, clinical response, and histologic endoscopic mucosal improvement (see Table 8).
Table 8. Proportion of Subjects with Ulcerative Colitis Meeting Efficacy Endpoints at Week 12 in UC1:
| Endpoint | Placebo | TREMFYA 200 mg Intravenous Infusion* | Treatment Difference (95% CI) |
|---|---|---|---|
| Clinical remission† | |||
| Total Population | N=280 8% | N=421 23% | 15% (10%, 20%)‡ |
| Prior biologic and/or JAK inhibitor failure§ | N=136 4% | N=208 13% | |
| Without prior biologic or JAK inhibitor failure¶ | N=144 12% | N=213 32% | |
| Endoscopic improvement# | |||
| Total Population | N=280 11% | N=421 27% | 16% (10%, 21%)‡ |
| Prior biologic and/or JAK inhibitor failure§ | N=136 5% | N=208 15% | |
| Without prior biologic or JAK inhibitor failure¶ | N=144 17% | N=213 38% | |
| Clinical responseÞ | |||
| Total Population | N=280 28% | N=421 62% | 34% (27%, 41%)‡ |
| Prior biologic and/or JAK inhibitor failure§ | N=136 20% | N=208 51% | |
| Without prior biologic or JAK inhibitor failure¶ | N=144 35% | N=213 71% | |
| Histologic endoscopic mucosal improvement (HEMI)ß | |||
| Total Population | N=280 8% | N=421 24% | 16% (11%, 21%)‡ |
| Prior biologic and/or JAK inhibitor failure§ | N=136 4% | N=208 13% | |
| Without prior biologic or JAK inhibitor failure¶ | N=144 10% | N=213 33% | |
* TREMFYA 200 mg as an intravenous infusion at Week 0, Week 4, and Week 8
† A stool frequency subscore of 0 or 1 and not increased from baseline, a rectal bleeding subscore of 0, and an endoscopy subscore of 0 or 1 with no friability.
‡ p<0.001, adjusted treatment difference (95% CI) based on Cochran-Mantel-Haenszel method (adjusted for stratification factors: biologic and/or JAK-inhibitor failure status and concomitant use of corticosteroids at baseline).
§ Includes inadequate response, loss of response, or intolerance to biologic therapy (TNF blockers, vedolizumab) and/or a Janus kinase (JAK) inhibitor for ulcerative colitis.
¶ Includes subjects that were biologic and/or JAK inhibitor naïve and subjects with biologic and/or JAK inhibitor exposure who did not meet criteria for failure. Of these, 7 subjects in the placebo group and 11 subjects in the TREMFYA group were previously exposed to, but did not fail, a biologic or JAK inhibitor.
# An endoscopy subscore of 0 or 1 with no friability.
Þ Decrease from induction baseline in the modified Mayo score by ≥30% and ≥2 points, with either a ≥1 point decrease from baseline in the rectal bleeding subscore or a rectal bleeding subscore of 0 or 1.
ß An endoscopy subscore of 0 or 1 with no friability and Geboes score ≤3.1 (indicating neutrophil infiltration in <5% of crypts, no crypt destruction, and no erosions, ulcerations, or granulation tissue).
Study UC1 was not designed to evaluate the relationship of histologic endoscopic mucosal improvement at Week 12 to disease progression and long-term outcomes.
Rectal Bleeding and Stool Frequency Subscores:
Decreases in rectal bleeding and stool frequency subscores were observed as early as Week 4 in subjects treated with TREMFYA compared to placebo.
Endoscopic Assessment:
Normalization of the endoscopic appearance of the mucosa (endoscopic remission) was defined as ES of 0. At Week 12 of UC1, a greater proportion of subjects treated with TREMFYA compared to placebo-treated subjects achieved endoscopic remission (15% vs 5%).
Fatigue Response:
In UC1, subjects treated with TREMFYA experienced a clinically meaningful improvement in fatigue, assessed by the PROMIS-Fatigue Short form 7a, at Week 12, compared to placebo-treated subjects. The effect of TREMFYA to improve fatigue after 12 weeks of induction has not been established.
Maintenance Trial: UC2
The maintenance trial (UC2) evaluated 568 subjects who received one of two intravenous TREMFYA induction regimens, including the recommended 200 mg regimen, for 12 weeks in Studies UC1 or UC3 (induction dose-finding study) and demonstrated clinical response per mMS after 12 weeks. Subjects were re-randomized to receive a subcutaneous maintenance regimen of either TREMFYA 100 mg every 8 weeks, TREMFYA 200 mg every 4 weeks, or placebo for up to an additional 44 weeks.
In UC2, 42% of subjects had failed (inadequate response, loss of response, or intolerance) treatment with one or more biologics or JAK inhibitors.
The primary endpoint was clinical remission at Week 44 defined by mMS. Secondary endpoints included corticosteroid-free clinical remission, endoscopic improvement, histologic endoscopic mucosal improvement, all at Week 44 and maintenance of clinical remission at Week 44 in subjects who achieved clinical remission 12 weeks after intravenous TREMFYA induction treatment (see Table 9).
Table 9. Proportion of Subjects with Ulcerative Colitis Meeting Efficacy Endpoints at Week 44 in UC2:
| Endpoint | Placebo | TREMFYA 100 mg Every 8 Weeks Subcutaneous Injection* | TREMFYA 200 mg Every 4 Weeks Subcutaneous Injection† | Treatment Difference vs Placebo (95% CI) | |
|---|---|---|---|---|---|
| TREMFYA 100 mg | TREMFYA 200 mg | ||||
| Clinical remission‡ | |||||
| Total population§ | N=190 19% | N=188 45% | N=190 50% | 25% (16%, 34%)¶ | 30% (21%, 38%)¶ |
| Prior biologic and/or JAK inhibitor failure# | N=75 8% | N=77 40% | N=88 40% | ||
| Without prior biologic or JAK inhibitor failureÞ | N=115 26% | N=111 49% | N=102 59% | ||
| Corticosteroid-free clinical remissionß | |||||
| Total population§ | N=190 18% | N=188 45% | N=190 49% | 26% (17%, 34%)¶ | 29% (20%, 38%)¶ |
| Prior biologic and/or JAK inhibitor failure# | N=75 7% | N=77 40% | N=88 40% | ||
| Without prior biologic or JAK inhibitor failureÞ | N=115 26% | N=111 49% | N=102 57% | ||
| Endoscopic improvementà | |||||
| Total population§ | N=190 19% | N=188 49% | N=190 52% | 30% (21%, 38%)¶ | 31% (22%, 40%)¶ |
| Prior biologic and/or JAK inhibitor failure# | N=75 8% | N=77 45% | N=88 42% | ||
| Without prior biologic or JAK inhibitor failureÞ | N=115 26% | N=111 52% | N=102 60% | ||
| Histologic endoscopic mucosal improvement (HEMI)è | |||||
| Total population§ | N=190 17% | N=188 44% | N=190 48% | 26% (17%, 34%)¶ | 30% (21%, 38%)¶ |
| Prior biologic and/or JAK inhibitor failure# | N=75 8% | N=77 38% | N=88 39% | ||
| Without prior biologic or JAK inhibitor failureÞ | N=115 23% | N=111 48% | N=102 56% | ||
| Maintenance of Clinical Remission at Week 44 in subjects who achieved clinical remission after 12 weeks of induction | |||||
| Total populationð | N=59 34% | N=66 61% | N=69 72% | 26% (9%, 43%)ø | 38% (23%, 54%)¶ |
| Prior biologic and/or JAK inhibitor failure# | N=15 27% | N=20 60% | N=18 56% | ||
| Without prior biologic or JAK inhibitor failureý | N=44 36% | N=46 61% | N=51 78% | ||
* TREMFYA 100 mg as a subcutaneous injection every 8 weeks after the induction
regimen
† TREMFYA 200 mg as a subcutaneous injection every 4 weeks after the induction
regimen
‡ A stool frequency subscore of 0 or 1 and not increased from induction baseline, a rectal bleeding subscore of 0, and an endoscopy subscore of 0 or 1 with no friability
§ Subjects who achieved clinical response 12 weeks following the intravenous
administration of TREMFYA in either induction study UC1 or induction dose-finding study UC3
¶ p<0.001, adjusted treatment difference (95% CI) based on Cochran-Mantel-Haenszel method adjusted for randomization stratification factors
# Includes inadequate response, loss of response, or intolerance to biologic therapy (TNF blockers, vedolizumab) and/or a Janus kinase (JAK) inhibitor for ulcerative colitis
Þ Includes subjects that were biologic and/or JAK inhibitor naïve and subjects with biologic and/or JAK inhibitor exposure who did not meet criteria for failure. Of these, 7 subjects in the placebo group, 6 subjects in the TREMFYA 100 mg group, and 6 subjects in the TREMFYA 200 mg group were previously exposed to, but did not fail, a biologic or JAK inhibitor
ß Not requiring any treatment with corticosteroids for at least 8 weeks prior to week 44 and also meeting the criteria for clinical remission at week 44
à An endoscopy subscore of 0 or 1 with no friability
è An endoscopy subscore of 0 or 1 with no friability and Geboes score ≤3.1 (indicating neutrophil infiltration in <5% of crypts, no crypt destruction, and no erosions, ulcerations, or granulation tissue)
ð Subjects who achieved clinical remission 12 weeks following intravenous administration of TREMFYA in either induction study UC1 or induction dose-finding study UC3
ø p<0.01, adjusted treatment difference (95% CI) based on Cochran-Mantel-Haenszel method adjusted for randomization stratification factors
ý Includes subjects that were biologic and/or JAK inhibitor naïve and subjects with biologic and/or JAK inhibitor exposure who did not meet criteria for failure. Of these, 3 subjects in the placebo group, 3 subjects in the TREMFYA 100 mg group, and 3 subjects in the TREMFYA 200 mg group were previously exposed to, but did not fail, a biologic or JAK inhibitor.
Study UC2 was not designed to evaluate the relationship of histologic endoscopic mucosal improvement at Week 44 to disease progression and long-term outcomes.
Endoscopic Assessment:
Normalization of the endoscopic appearance of the mucosa (endoscopic remission) was defined as ES of 0. In UC2, greater proportions of subjects treated with TREMFYA 100 mg every 8 weeks or TREMFYA 200 mg every 4 weeks achieved endoscopic remission at Week 44 compared to placebo-treated subjects (35% and 34%, respectively, vs. 15%).
© All content on this website, including data entry, data processing, decision support tools, "RxReasoner" logo and graphics, is the intellectual property of RxReasoner and is protected by copyright laws. Unauthorized reproduction or distribution of any part of this content without explicit written permission from RxReasoner is strictly prohibited. Any third-party content used on this site is acknowledged and utilized under fair use principles.