TREMFYA Solution for injection Ref.[8930] Active ingredients: Guselkumab
Source: European Medicines Agency (EU) Revision Year: 2025 Publisher: Janssen-Cilag International NV, Turnhoutseweg 30, B-2340 Beerse, Belgium
Pharmacodynamic properties
Pharmacotherapeutic group: Immunosuppressants, interleukin inhibitors
ATC code: L04AC16
Mechanism of action
Guselkumab is a human IgG1λ monoclonal antibody (mAb) that binds selectively to the interleukin 23 (IL-23) protein with high specificity and affinity through the antigen binding site. IL-23 is a cytokine that is involved in inflammatory and immune responses. By blocking IL-23 from binding to its receptor, guselkumab inhibits IL-23-dependent cell signalling and release of proinflammatory cytokines.
Levels of IL-23 are elevated in the skin of patients with plaque psoriasis. In patients with ulcerative colitis or Crohn's disease, levels of IL-23 are elevated in the colon tissue. In in vitro models, guselkumab was shown to inhibit the bioactivity of IL-23 by blocking its interaction with cell surface IL-23 receptor, disrupting IL-23-mediated signalling, activation and cytokine cascades. Guselkumab exerts clinical effects in plaque psoriasis, psoriatic arthritis, ulcerative colitis, and Crohn's disease through blockade of the IL-23 cytokine pathway.
Myeloid cells expressing Fc-gamma receptor 1 (CD64) have been shown to be a predominant source of IL-23 in inflamed tissue in psoriasis, ulcerative colitis, and Crohn's disease. Guselkumab has demonstrated in vitro blocking of IL-23 and binding to CD64. These results indicate that guselkumab is able to neutralise IL-23 at the cellular source of inflammation.
Pharmacodynamic effects
In a Phase I study, treatment with guselkumab resulted in reduced expression of IL-23/Th17 pathway genes and psoriasis-associated gene expression profiles, as shown by analyses of mRNA obtained from lesional skin biopsies of patients with plaque psoriasis at Week 12 compared to baseline. In the same Phase I study, treatment with guselkumab resulted in improvement of histological measures of psoriasis at Week 12, including reductions in epidermal thickness and T-cell density. In addition, reduced serum IL-17A, IL-17F and IL-22 levels compared to placebo were observed in guselkumab treated patients in Phase II and Phase III plaque psoriasis studies. These results are consistent with the clinical benefit observed with guselkumab treatment in plaque psoriasis.
In psoriatic arthritis patients in Phase III studies, serum levels of acute phase proteins C-reactive protein, serum amyloid A, and IL-6, and Th17 effector cytokines IL-17A, IL-17F and IL-22 were elevated at baseline. Guselkumab decreased the levels of these proteins within 4 weeks of initiation of treatment. Guselkumab further reduced the levels of these proteins by Week 24 compared to baseline and also to placebo.
In patients with ulcerative colitis or Crohn's disease, guselkumab treatment led to decreases in inflammatory markers including C-reactive protein (CRP) and faecal calprotectin through induction Week 12, which were sustained through one year of maintenance treatment. Serum protein levels of IL-17A, IL-22 and IFNγ were reduced as early as Week 4, and continued to decrease through induction Week 12. Guselkumab also reduced colon mucosal biopsy RNA levels of IL-17A, IL-22 and IFNγ at Week 12.
Clinical efficacy and safety
Adult plaque psoriasis
The efficacy and safety of guselkumab was assessed in three randomised, double-blind, active controlled phase III studies in adult patients with moderate to severe plaque psoriasis, who were candidates for phototherapy or systemic therapy.
VOYAGE 1 and VOYAGE 2
Two studies (VOYAGE 1 and VOYAGE 2) evaluated the efficacy and safety of guselkumab versus placebo and adalimumab in 1829 adult patients. Patients randomised to guselkumab (N=825) received 100 mg at Weeks 0 and 4, and every 8 weeks (q8w) thereafter through Week 48 (VOYAGE 1) and Week 20 (VOYAGE 2). Patients randomised to adalimumab (N=582) received 80 mg at Week 0 and 40 mg at Week 1, followed by 40 mg every other week (q2w) through Week 48 (VOYAGE 1) and Week 23 (VOYAGE 2). In both studies, patients randomised to placebo (N=422) received guselkumab 100 mg at Weeks 16, 20 and q8w thereafter. In VOYAGE 1, all patients, including those randomised to adalimumab at Week 0, started to receive open-label guselkumab q8w at Week 52. In VOYAGE 2, patients randomised to guselkumab at Week 0 who were Psoriasis Area and Severity Index (PASI) 90 responders at Week 28 were re-randomised to either continue treatment with guselkumab q8w (maintenance treatment) or receive placebo (withdrawal treatment). Withdrawal patients re-initiated guselkumab (dosed at time of retreatment, 4 weeks later and q8w thereafter) when they experienced at least a 50% loss of their Week 28 PASI improvement. Patients randomised to adalimumab at Week 0 who were PASI 90 non-responders received guselkumab at Weeks 28, 32 and q8w thereafter. In VOYAGE 2, all patients started to receive open-label guselkumab q8w at Week 76.
Baseline disease characteristics were consistent for the study populations in VOYAGE 1 and 2 with a median body surface area (BSA) of 22% and 24%, a median baseline PASI score of 19 for both studies, a median baseline dermatology quality of life index (DLQI) score of 14 and 14.5, a baseline investigator global assessment (IGA) score of severe for 25% and 23% of patients, and a history of psoriatic arthritis for 19% and 18% of patients, respectively.
Of all patients included in VOYAGE 1 and 2, 32% and 29% were naïve to both conventional systemic and biologic therapy, 54% and 57% had received prior phototherapy, and 62% and 64% had received prior conventional systemic therapy, respectively. In both studies, 21% had received prior biologic therapy, including 11% who had received at least one anti-tumour necrosis factor alpha (TNFα) agent, and approximately 10% who had received an anti-IL-12/IL-23 agent.
The efficacy of guselkumab was evaluated with respect to overall skin disease, regional disease (scalp, hand and foot and nails) and quality of life and patient reported outcomes. The co-primary endpoints in VOYAGE 1 and 2 were the proportion of patients who achieved an IGA score of cleared or minimal (IGA 0/1) and a PASI 90 response at Week 16 versus placebo (see Table 3).
Overall skin disease:
Treatment with guselkumab resulted in significant improvements in the measures of disease activity compared to placebo and adalimumab at Week 16 and compared to adalimumab at Weeks 24 and 48. The key efficacy results for the primary and major secondary study endpoints are shown in Table 3 below.
Table 3. Summary of clinical responses in VOYAGE 1 and VOYAGE 2:
| Number of patients (%) | ||||||
|---|---|---|---|---|---|---|
| VOYAGE 1 | VOYAGE 2 | |||||
| Placebo (N=174) | guselkumab (N=329) | adalimumab (N=334) | Placebo (N=248) | guselkumab (N=496) | adalimumab (N=248) | |
| Week 16 | ||||||
| PASI 75 | 10 (5.7) | 300 (91.2)a | 244 (73.1)b | 20 (8.1) | 428 (86.3)a | 170 (68.5)b |
| PASI 90 | 5 (2.9) | 241 (73.3)c | 166 (49.7)b | 6 (2.4) | 347 (70.0)c | 116 (46.8)b |
| PASI 100 | 1 (0.6) | 123 (37.4)a | 57 (17.1)d | 2 (0.8) | 169 (34.1)a | 51 (20.6)d |
| IGA 0/1 | 12 (6.9) | 280 (85.1)c | 220 (65.9)b | 21 (8.5) | 417 (84.1)c | 168 (67.7)b |
| IGA 0 | 2 (1.1) | 157 (47.7)a | 88 (26.3)d | 2 (0.8) | 215 (43.3)a | 71 (28.6)d |
| Week 24 | ||||||
| PASI 75 | - | 300 (91.2) | 241 (72.2)e | - | 442 (89.1) | 176 (71.0)e |
| PASI 90 | - | 264 (80.2) | 177 (53.0)b | - | 373 (75.2) | 136 (54.8)b |
| PASI 100 | - | 146 (44.4) | 83 (24.9)e | - | 219 (44.2) | 66 (26.6)e |
| IGA 0/1 | - | 277 (84.2) | 206 (61.7)b | - | 414 (83.5) | 161 (64.9)b |
| IGA 0 | - | 173 (52.6) | 98 (29.3)b | - | 257 (51.8) | 78 (31.5)b |
| Week 48 | ||||||
| PASI 75 | - | 289 (87.8) | 209 (62.6)e | - | - | - |
| PASI 90 | - | 251 (76.3) | 160 (47.9)b | - | - | - |
| PASI 100 | - | 156 (47.4) | 78 (23.4)e | - | - | - |
| IGA 0/1 | - | 265 (80.5) | 185 (55.4)b | - | - | - |
| IGA 0 | - | 166 (50.5) | 86 (25.7)b | - | - | - |
a p<0.001 for comparison between guselkumab and placebo.
b p<0.001 for comparison between guselkumab and adalimumab for major secondary endpoints.
c p<0.001 for the comparisons between guselkumab and placebo for the co-primary endpoints.
d comparisons between guselkumab and adalimumab were not performed.
e p<0.001 for comparison between guselkumab and adalimumab.
Response over time:
Guselkumab demonstrated rapid onset of efficacy, with a significantly higher percent improvement in PASI as compared with placebo as early as Week 2 (p<0.001). The percentage of patients achieving a PASI 90 response was numerically higher for guselkumab than adalimumab starting at Week 8 with the difference reaching a maximum around Week 20 (VOYAGE 1 and 2) and maintained through Week 48 (VOYAGE 1) (see Figure 1).
Figure 1. Percent of patients who achieved a PASI 90 response through week 48 by visit (patients randomised at Week 0) in VOYAGE 1:
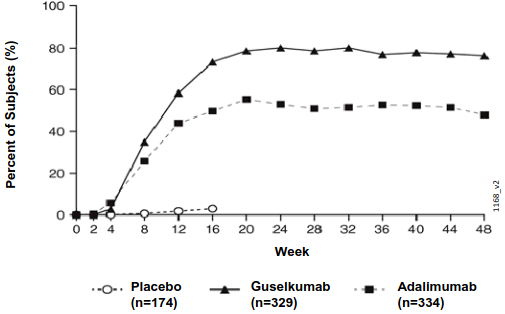
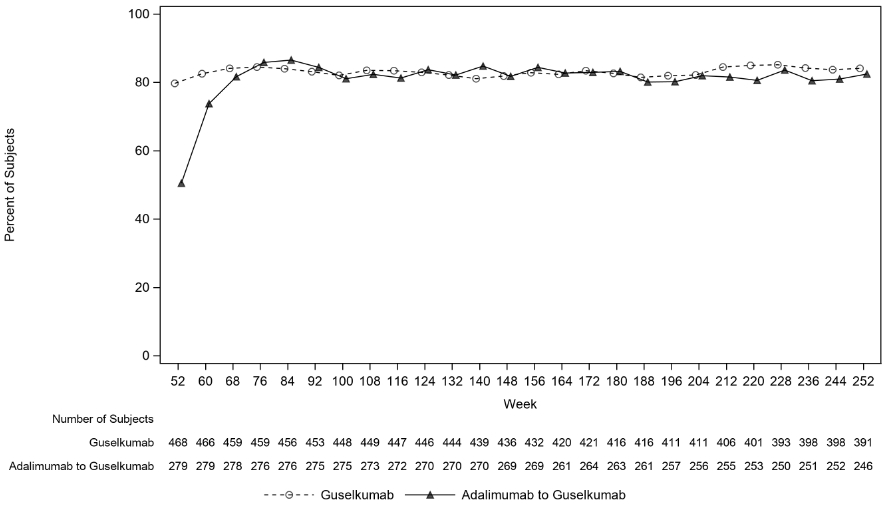
In VOYAGE 1, for patients receiving continuous guselkumab treatment, the PASI 90 response rate was maintained from Week 52 through Week 252. For patients randomised to adalimumab at Week 0 who crossed over to guselkumab at Week 52, the PASI 90 response rate increased from Week 52 through Week 76 and was then maintained through Week 252 (see Figure 2).
Figure 2. Percent of patients who achieved a PASI 90 response by visit in the open-label phase in VOYAGE 1:
The efficacy and safety of guselkumab was demonstrated regardless of age, gender, race, body weight, plaques location, PASI baseline severity, concurrent psoriatic arthritis, and previous treatment with a biologic therapy. Guselkumab was efficacious in conventional systemic-naive, biologic-naive, and biologic-exposed patients.
In VOYAGE 2, 88.6% of patients receiving guselkumab maintenance treatment at Week 48 were PASI 90 responders compared to 36.8% of patients who were withdrawn from treatment at Week 28 (p<0.001). Loss of PASI 90 response was noted as early as 4 weeks after withdrawal of guselkumab treatment with a median time to loss of PASI 90 response of approximately 15 weeks. Among patients who were withdrawn from treatment and subsequently re-initiated guselkumab, 80% regained a PASI 90 response when assessed 20 weeks after initiation of retreatment.
In VOYAGE 2, among 112 patients randomised to adalimumab who failed to achieve a PASI 90 response at Week 28, 66% and 76% achieved a PASI 90 response after 20 and 44 weeks of treatment with guselkumab, respectively. In addition, among 95 patients randomised to guselkumab who failed to achieve a PASI 90 response at Week 28, 36% and 41% achieved a PASI 90 response with an additional 20 and 44 weeks of continued treatment with guselkumab, respectively. No new safety findings were observed in patients who switched from adalimumab to guselkumab.
Regional disease:
In VOYAGE 1 and 2, significant improvements were seen in scalp, hand and foot, and nail psoriasis (as measured by the Scalp-specific Investigator Global Assessment [ss-IGA], Physician's Global Assessment of Hands and/or Feet [hf-PGA], Fingernail Physician's Global Assessment [f-PGA] and Nail Psoriasis Severity Index [NAPSI], respectively) in guselkumab treated patients compared to placebo treated patients at Week 16 (p<0.001, Table 4). Guselkumab demonstrated superiority compared to adalimumab for scalp and hand and foot psoriasis at Week 24 (VOYAGE 1 and 2) and Week 48 (VOYAGE 1) (p≤0.001, except for hand and foot psoriasis at Week 24 [VOYAGE 2] and Week 48 [VOYAGE 1], p<0.05).
Table 4. Summary of regional disease responses in VOYAGE 1 and VOYAGE 2:
| VOYAGE 1 | VOYAGE 2 | |||||
|---|---|---|---|---|---|---|
| Placebo | guselkumab | adalimumab | Placebo | guselkumab | adalimumab | |
| ss-IGA (N)a | 145 | 277 | 286 | 202 | 408 | 194 |
| ss-IGA 0/1b, n (%) Week 16 | 21 (14.5) | 231 (83.4)c | 201 (70.3)d | 22 (10.9) | 329 (80.6)c | 130 (67.0)d |
| hf-PGA (N)a | 43 | 90 | 95 | 63 | 114 | 56 |
| hf-PGA 0/1b, n (%) Week 16 | 6 (14.0) | 66 (73.3)e | 53 (55.8)d | 9 (14.3) | 88 (77.2)e | 40 (71.4)d |
| f-PGA (N)a | 88 | 174 | 173 | 123 | 246 | 124 |
| f-PGA 0/1, n (%) Week 16 | 14 (15.9) | 68 (39.1)e | 88 (50.9)d | 18 (14.6) | 128 (52.0)e | 74 (59.7)d |
| NAPSI (N)a | 99 | 194 | 191 | 140 | 280 | 140 |
| Percent Improvement, mean (SD) Week 16 | -0.9 (57.9) | 34.4 (42.4)e | 38.0 (53.9)d | 1.8 (53.8) | 39.6 (45.6)e | 46.9 (48.1)d |
a Includes only subjects with ss-IGA, f-PGA, hf-PGA score ≥2 at baseline or baseline NAPSI score >0.
b Includes only subjects achieving ≥ 2-grade improvement from baseline in ss-IGA and/or hf-PGA.
c p<0.001 for comparison between guselkumab and placebo for the major secondary endpoint.
d comparisons between guselkumab and adalimumab were not performed.
e p<0.001 for comparison between guselkumab and placebo.
Health-related quality of life / Patient reported outcomes:
Across VOYAGE 1 and 2 significantly greater improvements in health-related quality of life as measured by Dermatology Life Quality Index (DLQI) and in patient-reported psoriasis symptoms (itching, pain, burning, stinging and skin tightness) and signs (skin dryness, cracking, scaling, shedding or flaking, redness and bleeding) as measured by the Psoriasis Symptoms and Signs Diary (PSSD) were observed in guselkumab patients compared to placebo patients at Week 16 (Table 5). Signs of improvement on patient-reported outcomes were maintained through Week 24 (VOYAGE 1 13 and 2) and Week 48 (VOYAGE 1). In VOYAGE 1, for patients receiving continuous guselkumab treatment, these improvements were maintained in the open-label phase through Week 252 (Table 6).
Table 5. Summary of patient reported outcomes at week 16 in VOYAGE 1 and VOYAGE 2:
| VOYAGE 1 | VOYAGE 2 | |||||
|---|---|---|---|---|---|---|
| Placebo | guselkumab | adalimumab | Placebo | guselkumab | adalimumab | |
| DLQI, patients with baseline score | 170 | 322 | 328 | 248 | 495 | 247 |
| Change from baseline, mean (standard deviation) | ||||||
| Week 16 | -0.6 (6.4) | -11.2 (7.2)c | -9.3 (7.8)b | -2.6 (6.9) | -11.3 (6.8)c | -9.7 (6.8)b |
| PSSD Symptom score, patients with baseline score >0 | 129 | 248 | 273 | 198 | 410 | 200 |
| Symptom score = 0, n (%) | ||||||
| Week 16 | 1 (0.8) | 67 (27.0)a | 45 (16.5)b | 0 | 112 (27.3)a | 30 (15.0)b |
| PSSD Sign score, patients with baseline score >0 | 129 | 248 | 274 | 198 | 411 | 201 |
| Sign score = 0, n (%) | ||||||
| Week 16 | 0 | 50 (20.2)a | 32 (11.7)b | 0 | 86 (20.9)a | 21 (10.4)b |
a p<0.001 for comparison between guselkumab and placebo.
b comparisons between guselkumab and adalimumab were not performed.
c p<0.001 for comparison between guselkumab and placebo for major secondary endpoints.
Table 6. Summary of patient reported outcomes in the open-label phase in VOYAGE 1:
| guselkumab | adalimumab-guselkumab | |||||
|---|---|---|---|---|---|---|
| Week 76 | Week 156 | Week 252 | Week 76 | Week 156 | Week 252 | |
| DLQI score >1 at baseline, n | 445 | 420 | 374 | 264 | 255 | 235 |
| Patients with DLQI 0/1 | 337 (75.7%) | 308 (73.3%) | 272 (72.7%) | 198 (75.0%) | 190 (74.5%) | 174 (74.0%) |
| PSSD Symptom Score, patients with baseline score >0 | 347 | 327 | 297 | 227 | 218 | 200 |
| Symptom score = 0, n (%) | 136 (39.2%) | 130 (39.8%) | 126 (42.4%) | 99 (43.6%) | 96 (44.0%) | 96 (48.0%) |
| PSSD Sign score, patients with baseline score >0 | 347 | 327 | 297 | 228 | 219 | 201 |
| Sign score = 0, n (%) | 102 (29.4%) | 94 (28.7%) | 98 (33.0%) | 71 (31.1%) | 69 (31.5%) | 76 (37.8%) |
In VOYAGE 2, guselkumab patients had significantly greater improvement from baseline compared to placebo in health-related quality of life, anxiety and depression, and work limitation measures at Week 16, as measured by the 36-item Short Form (SF-36) health survey questionnaire, Hospital Anxiety and Depression Scale (HADS), and Work Limitations Questionnaire (WLQ), respectively. The improvements in SF-36, HADS and WLQ were all maintained through Week 48 and in the open-label phase through Week 252 among patients randomised to maintenance therapy at Week 28.
NAVIGATE
The NAVIGATE study examined the efficacy of guselkumab in patients who had an inadequate response (ie, who had not achieved a 'cleared' or 'minimal' response defined as IGA ≥2) to ustekinumab at Week 16. All patients (N=871) received open-label ustekinumab (45 mg ≤100 kg and 90 mg >100 kg) at Weeks 0 and 4. At Week 16, 268 patients with an IGA ≥2 score were randomised to either continue ustekinumab treatment (N=133) q12w, or to initiate guselkumab treatment (N=135) at Weeks 16, 20, and q8w thereafter. Baseline characteristics for randomised patients were similar to those observed in VOYAGE 1 and 2.
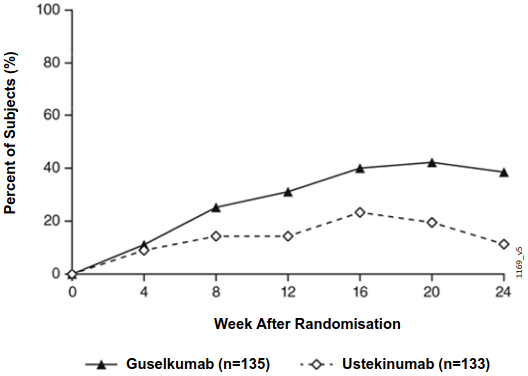
After randomisation, the primary endpoint was the number of post-randomisation visits between Weeks 12 and 24 at which patients achieved an IGA score 0/1 and had ≥ 2 grade improvement. Patients were examined at four week intervals for a total of four visits. Among patients who inadequately responded to ustekinumab at the time of randomisation, significantly greater improvement of efficacy was observed in patients who switched to guselkumab treatment compared to patients who continued ustekinumab treatment. Between 12 and 24 weeks after randomisation, guselkumab patients achieved an IGA score 0/1 with ≥2 grade improvement twice as often as ustekinumab patients (mean 1.5 vs 0.7 visits, respectively, p<0.001). Additionally, at 12 weeks after randomisation a higher proportion of guselkumab patients compared to ustekinumab patients achieved an IGA score 0/1 and ≥2 grade improvement (31.1% vs. 14.3%, respectively; p=0.001) and a PASI 90 response (48% vs 23%, respectively, p<0.001). Differences in response rates between guselkumab and ustekinumab treated patients were noted as early as 4 weeks after randomisation (11.1% and 9.0%, respectively) and reached a maximum 24 weeks after randomisation (see Figure 3). No new safety findings were observed in patients who switched from ustekinumab to guselkumab.
Figure 3. Percent of subjects who achieved an IGA Score of cleared (0) or minimal (1) and at least a 2-grade improvement in IGA from week 0 through week 24 by visit after randomisation in NAVIGATE:
ECLIPSE
Efficacy and safety of guselkumab were also investigated in a double-blind study compared to secukinumab. Patients were randomised to receive guselkumab (N=534; 100 mg at Week 0, 4 and q8w thereafter), or secukinumab (N=514; 300 mg at Week 0, 1, 2, 3, 4, and q4w thereafter). The last dose was at week 44 for both treatment groups.
Baseline disease characteristics were consistent with a population of moderate to severe plaque psoriasis with a median BSA of 20%, a median PASI score of 18, and an IGA score of severe for 24% of patients.
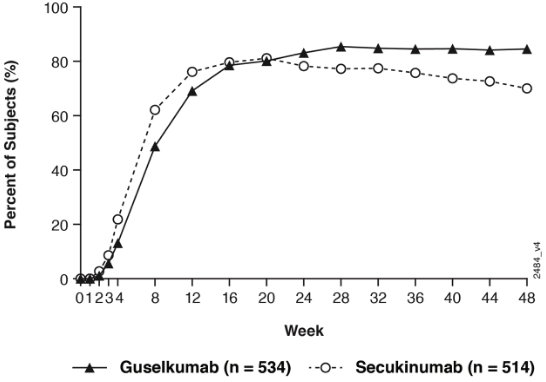
Guselkumab was superior to secukinumab as measured by the primary endpoint of PASI 90 response at Week 48 (84.5% versus 70.0%, p<0.001). Comparative PASI response rates are presented in Table 7.
Table 7. PASI response rates in ECLIPSE:
| Number of patients (%) | ||
|---|---|---|
| guselkumab (N=534) | secukinumab (N=514) | |
| Primary Endpoint | ||
| PASI 90 response at Week 48 | 451 (84.5%)a | 360 (70.0%) |
| Major Secondary Endpoints | ||
| PASI 75 response at both Week 12 and Week 48 | 452 (84.6%)b | 412 (80.2%) |
| PASI 75 response at Week 12 | 477 (89.3%)c | 471 (91.6%) |
| PASI 90 response at Week 12 | 369 (69.1%)c | 391 (76.1%) |
| PASI 100 response at Week 48 | 311 (58.2%)c | 249 (48.4%) |
a p<0.001 for superiority
b p<0.001 for non-inferiority, p=0.062 for superiority
c formal statistical testing was not performed
Guselkumab and secukinumab PASI 90 response rates through Week 48 are presented in Figure 4.
Figure 4. Percent of patients who achieved a PASI 90 response through week 48 by visit (Patients randomised at Week 0) in ECLIPSE:
Psoriatic arthritis (PsA)
Guselkumab has been shown to improve signs and symptoms, physical function and health-related quality of life, and reduce the rate of progression of peripheral joint damage in adult patients with active PsA.
DISCOVER 1 and DISCOVER 2
Two randomised, double-blind, placebo-controlled Phase III studies (DISCOVER 1 and DISCOVER 2) evaluated the efficacy and safety of guselkumab versus placebo in adult patients with active PsA (≥3 swollen and ≥3 tender joints, and a C-reactive protein (CRP) level of ≥0.3 mg/dL in DISCOVER 1, and ≥5 swollen and ≥5 tender joints, and a CRP level of ≥0.6 mg/dL in DISCOVER 2), despite conventional synthetic (cs)DMARD, apremilast, or nonsteroidal anti-inflammatory drug (NSAID) therapy. Patients in these studies had a diagnosis of PsA based on the Classification criteria for Psoriatic Arthritis [CASPAR]) for a median duration of 4 years. Patients with different subtypes of PsA were enrolled in both studies, including polyarticular arthritis with the absence of rheumatoid nodules (40%), spondylitis with peripheral arthritis (30%), asymmetric peripheral arthritis (23%), distal interphalangeal involvement (7%) and arthritis mutilans (1%). Over 65% and 42% of the patients had enthesitis and dactylitis at baseline, respectively, and over 75% of patients had ≥3% BSA psoriasis skin involvement. DISCOVER 1 and DISCOVER 2 evaluated 381 and 739 patients, respectively, who received treatment with guselkumab 100 mg administered at Weeks 0 and 4 followed by every 8 weeks (q8w) or guselkumab 100 mg q4w, or placebo. At Week 24, placebo patients in both studies crossed over to receive guselkumab 100 mg q4w. Approximately 58% of patients in both studies continued on stable doses of MTX (≤25 mg/week).
In both studies over 90% of patients had prior csDMARD use. In DISCOVER 1, 31% of patients had previously received anti-TNFα treatment. In DISCOVER 2, all patients were naive to biologic therapy.
Signs and symptoms:
Treatment with guselkumab resulted in significant improvements in the measures of disease activity compared to placebo at Week 24. The primary endpoint in both studies was the percentage of patients who achieved American College of Rheumatology (ACR) 20 response at Week 24. The key efficacy results are shown in Table 8.
Table 8. Clinical responses in DISCOVER 1 and DISCOVER 2:
| DISCOVER 1 | DISCOVER 2 | |||||
|---|---|---|---|---|---|---|
| Placebo (N=126) | guselkumab 100 mg q8w (N=127) | guselkumab 100 mg q4w (N=128) | Placebo (N=246) | guselkumab 100 mg q8w (N=248) | guselkumab 100 mg q4w (N=245) | |
| ACR 20 response | ||||||
| Week 16 | 25.4% | 52.0%b | 60.2%b | 33.7% | 55.2%g | 55.9%c |
| Difference from placebo (95% CI) | - | 26.7 (15.3, 38.1) | 34.8 (23.5, 46.0) | - | 21.5 (13.1, 30.0) | 22.2 (13.7, 30.7) |
| Week 24 | 22.2% | 52.0%a | 59.4%a | 32.9% | 64.1%a | 63.7%a |
| Difference from placebo (95% CI) | - | 29.8 (18.6, 41.1) | 37.1 (26.1, 48.2) | - | 31.2 (22.9, 39.5) | 30.8 (22.4, 39.1) |
| ACR 50 response | ||||||
| Week 16 | 12.7% | 22.8%d | 26.6%c | 9.3% | 28.6%g | 20.8%c |
| Difference from placebo (95% CI) | - | 10.2 (1.0, 19.3) | 13.9 (4.4, 23.4) | - | 19.3 (12.6, 25.9) | 11.5 (5.2, 17.7) |
| Week 24 | 8.7% | 29.9%b | 35.9%b | 14.2% | 31.5%g | 33.1%c |
| Difference from placebo (95% CI) | - | 21.4 (12.1, 30.7) | 27.2 (17.6, 36.8) | - | 17.2 (10.0, 24.4) | 18.8 (11.5, 26.1) |
| ACR 70 response | ||||||
| Week 24 | 5.6% | 11.8%d | 20.3%b | 4.1% | 18.5%g | 13.1%c |
| Difference from placebo (95% CI) | - | 6.4 (-0.3, 13.1) | 14.8 (6.9, 22.7) | - | 14.5 (9.1, 19.9) | 9.0 (4.1, 13.8) |
| DAS 28 (CRP) LSMean changei from baseline | ||||||
| Week 24c | -0.70 | -1.43b | -1.61b | -0.97 | -1.59b | -1.62b |
| Difference from placebo (95% CI) | - | -0.73 (-0.98, -0.48) | -0.91 (-1.16, -0.66) | - | -0.61 (-0.80, -0.43) | -0.65 (-0.83, -0.47) |
| Minimal Disease Activity (MDA) | ||||||
| Week 24 | 11.1% | 22.8%f | 30.5%e | 6.1% | 25.0%e | 18.8%e |
| Difference from placebo (95% CI) | - | 11.9 (2.9, 20.9) | 19.3 (9.7, 28.9) | - | 18.9 (12.8, 25.0) | 12.7 (7.0, 18.4) |
| Patients with ≥3% BSA and IGA ≥2 | ||||||
| n=78 | n=82 | n=89 | n=183 | n=176 | n=184 | |
| IGA responseh | ||||||
| Week 24 | 15.4% | 57.3%b | 75.3%b | 19.1% | 70.5%b | 68.5%b |
| Difference from placebo (95% CI) | - | 42.0 (28.9, 55.1) | 60.0 (48.3, 71.8) | - | 50.9 (42.2, 59.7) | 49.8 (41.2, 58.4) |
| PASI 90 response | ||||||
| Week 16 | 10.3% | 45.1%e | 52.8%e | 8.2% | 55.1%e | 53.8%e |
| Difference from placebo (95% CI) | - | 34.9 (22.2, 47.6) | 42.6 (30.5, 54.8) | - | 46.6 (38.4, 54.8) | 45.6 (37.6, 53.6) |
| Week 24 | 11.5% | 50.0%e | 62.9%e | 9.8% | 68.8%e | 60.9%e |
| Difference from placebo (95% CI) | - | 38.6 (25.8, 51.4) | 51.7 (39.7, 63.7) | - | 58.6 (50.6, 66.6) | 51.3 (43.2, 59.3) |
a p<0.001 (primary endpoint)
b p<0.001 (major secondary endpoint)
c p=0.006 (major secondary endpoint)
d not statistically significant p=0.086 (major secondary endpoint)
e nominal p<0.001
f nominal p=0.012
g not formally tested in the hierarchical testing procedure, nominal p<0.001 (major secondary endpoint)
h defined as a IGA response of 0 (cleared) or 1 (minimal) and ≥ 2-grade reduction from baseline in the IGA psoriasis score
i LSmean change = least squares mean change
Clinical response was maintained up to Week 52 as assessed by ACR 20/50/70, DAS 28 (CRP), MDA, IGA and PASI 90 response rates in DISCOVER 1 and DISCOVER 2 (see Table 9).
Table 9. Clinical responses in DISCOVER 1 and DISCOVER 2 at week 52a:
| DISCOVER 1 | DISCOVER 2 | |||
|---|---|---|---|---|
| guselkumab 100 mg q8w | guselkumab 100 mg q4w | guselkumab 100 mg q8w | guselkumab 100 mg q4w | |
| ACR 20 | ||||
| Nb | 112 | 124 | 234 | 228 |
| % Response | 67.9% | 75.8% | 79.1% | 75.9% |
| ACR 50 | ||||
| Nb | 113 | 124 | 234 | 228 |
| % Response | 43.4% | 55.6% | 51.3% | 49.1% |
| ACR 70 | ||||
| Nb | 114 | 124 | 234 | 228 |
| % Response | 28.9% | 29.8% | 29.5% | 28.1% |
| DAS 28 (CRP) change from baseline | ||||
| Nc | 112 | 123 | 234 | 227 |
| Mean (SD) | -2.03 (1.250) | -1.99 (1.062) | -2.08 (1.121) | -2.11 (1.128) |
| MDA | ||||
| Nb | 112 | 124 | 234 | 228 |
| % Response | 33.9% | 40.3% | 32.9% | 36.8% |
| Patients with ≥3% BSA and IGA ≥2 at baseline | ||||
| IGA Response | ||||
| Nb | 75 | 88 | 170 | 173 |
| % Response | 69.3% | 83.0% | 77.1% | 84.4% |
| PASI 90 | ||||
| Nb | 75 | 88 | 170 | 173 |
| % Response | 66.7% | 76.1% | 77.1% | 81.5% |
a There was no placebo arm beyond Week 24.
b Evaluable subjects with an observed response status.
c Subjects have an observed change from baseline.
Clinical response was maintained up to Week 100 as assessed by ACR 20/50/70, DAS 28 (CRP), MDA, IGA and PASI 90 response rates in DISCOVER 2 (see Table 10).
Table 10. Clinical responses in DISCOVER 2 at week 100a:
| guselkumab 100 mg q8w | guselkumab 100 mg q4w | |
|---|---|---|
| ACR 20 | ||
| Nb | 223 | 219 |
| % Response | 82.1% | 84.9% |
| ACR 50 | ||
| Nb | 224 | 220 |
| % Response | 60.7% | 62.3% |
| ACR 70 | ||
| Nb | 224 | 220 |
| % Response | 39.3% | 38.6% |
| DAS 28 (CRP) change from baseline | ||
| Nc | 223 | 219 |
| Mean (SD) | -2.37 (1.215) | -2.36 (1.120) |
| MDA | ||
| Nb | 224 | 220 |
| % Response | 44.6% | 42.7% |
| Patients with ≥3% BSA and IGA ≥2 at baseline | ||
| IGA Response | ||
| Nb | 165 | 170 |
| % Response | 76.4% | 82.4% |
| PASI 90 | ||
| Nb | 164 | 170 |
| % Response | 75.0% | 80.0% |
a There was no placebo arm beyond Week 24.
b Evaluable subjects with an observed response status.
c Subjects have an observed change from baseline.
Response over time:
In DISCOVER 2, a greater ACR 20 response was observed in both guselkumab groups compared to placebo as early as Week 4 and the treatment difference continued to increase over time through Week 24 (Figure 5).
Figure 5. ACR 20 response by visit through week 24 in DISCOVER 2:
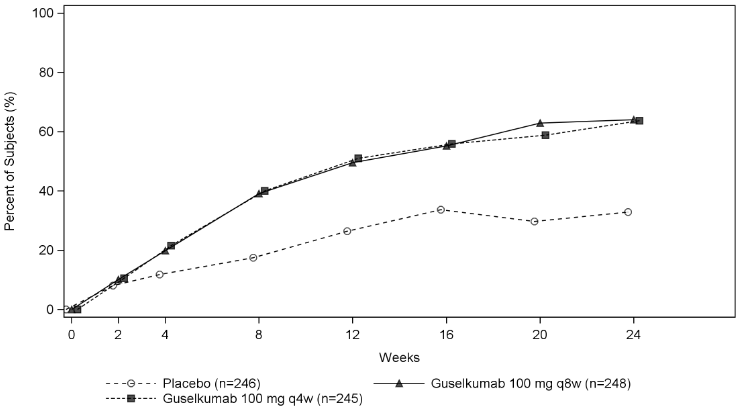
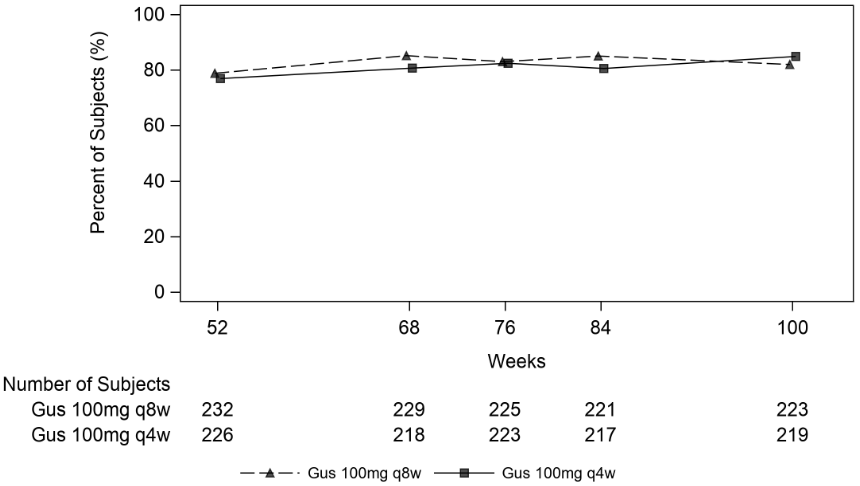
In DISCOVER 2, for subjects receiving continuous guselkumab treatment at week 24, ACR 20 20 response was maintained from Week 24 to Week 52 (see Figure 6). For subjects receiving continuous guselkumab treatment at week 52, ACR 20 response was maintained from Week 52 to Week 100 (see Figure 7).
Figure 6. ACR 20 response by visit from week 24 through week 52 in DISCOVER 2:
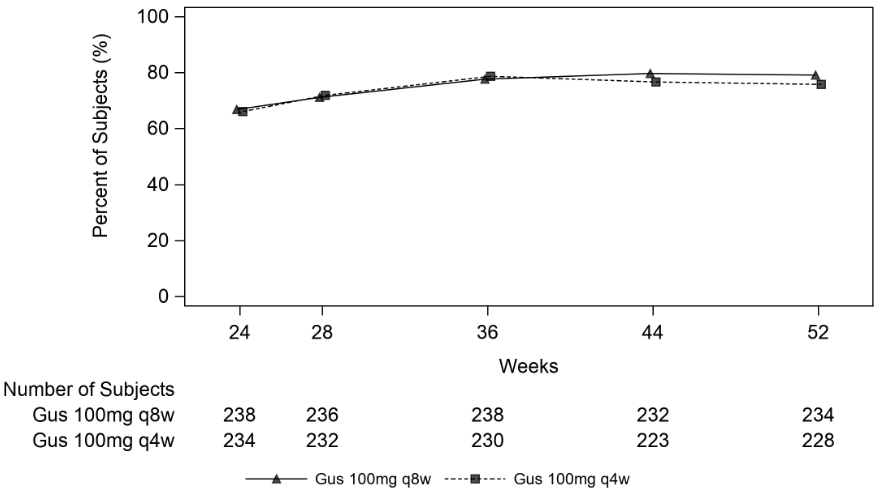
Figure 7. ACR 20 response by visit from week 52 through week 100 in DISCOVER 2:
Responses observed in the guselkumab groups were similar regardless of concomitant csDMARD use, including MTX (DISCOVER 1 and 2). Additionally, examination of age, gender, race, body weight, and previous csDMARD use (DISCOVER 1 and 2) and previous anti-TNFα use (DISCOVER 1), did not identify differences in response to guselkumab among these subgroups.
In DISCOVER 1 and 2, improvements were shown in all components of the ACR scores including patient assessment of pain. At Week 24 in both studies, the proportion of patients achieving a modified PsA response criteria (PsARC) response was greater in the guselkumab groups compared to placebo. PsARC responses were maintained from Week 24 to Week 52 in DISCOVER 1 and Week 100 in DISCOVER 2.
Dactylitis and enthesitis were assessed based on pooled data from DISCOVER 1 and 2. At Week 24, among patients with dactylitis at baseline, the proportion of patients with dactylitis resolution was greater in the guselkumab q8w group (59.4%, nominal p < 0.001) and q4w group (63.5%, p = 0.006) compared to placebo (42.2%). At Week 24, among patients with enthesitis at baseline, the proportion of patients with enthesitis resolution was greater in the guselkumab q8w group (49.6%, nominal p < 0.001) and q4w group (44.9%, p = 0.006) compared to placebo (29.4%). At Week 52, the proportions of patients with dactylitis resolution (81.2% in q8w group and 80.4% in q4w group) and enthesitis resolution (62.7% in q8w group and 60.9% in q4w group) were maintained. In DISCOVER 2, among patients with dactylitis and enthesitis at baseline, the proportion of patients with dactylitis resolution (91.1% in q8w group and 82.9% in q4w group) and enthesitis resolution (77.5% in q8w group and 67.7% in q4w group) were maintained at Week 100.
In DISCOVER 1 and 2, patients treated with guselkumab who had spondylitis with peripheral arthritis as their primary presentation, demonstrated greater improvement from baseline in Bath Ankylosing Spondylitis Disease Activity Index (BASDAI) compared to placebo at Week 24. Improvement in BASDAI was maintained from Week 24 to Week 52 in DISCOVER 1 and Week 100 in DISCOVER 2.
Radiographic response:
In DISCOVER 2, inhibition of structural damage progression was measured radiographically and expressed as the mean change from baseline in the total modified van der Heijde-Sharp (vdH-S) score. At Week 24, the guselkumab q4w group demonstrated statistically significantly less radiographic progression and the guselkumab q8w group showed numerically less progression than placebo (Table 11). The observed benefit with the guselkumab q4w dosing regimen on inhibition of radiographic progression (i.e., smaller mean change from baseline in total modified vdH-S score in the q4w group versus placebo) was most pronounced in patients with both a high C-reactive protein value and high number of joints with erosions at baseline.
Table 11. Change from baseline in total modified vdH-S score at week 24 in DISCOVER 2:
| N | LS Mean changec (95% CId) from baseline in modified vdH-S score at Week 24 | |
|---|---|---|
| Placebo | 246 | 0.95 (0.61, 1.29) |
| guselkumab 100 mg q8w | 248 | 0.52a (0.18, 0.86) |
| guselkumab 100 mg q4w | 245 | 0.29b (-0.05, 0.63) |
a not statistically significant p=0.068 (major secondary endpoint)
b p=0.006 (major secondary endpoint)
c LSmean change = least squares mean change
d CI = confidence interval
At Week 52 and Week 100, the mean change from baseline in total modified vdH-S was similar in the guselkumab q8w and q4w groups (Table 12).
Table 12. Change from baseline in total modified vdH-S score at week 52 and week 100 in DISCOVER 2:
| Na | Mean change (SDb) from baseline in total modified vdH-S score | |
|---|---|---|
| Week 52 | ||
| guselkumab 100 mg q8w | 235 | 0.97 (3.623) |
| guselkumab 100 mg q4w | 229 | 1.07 (3.843) |
| Week 100 | ||
| guselkumab 100 mg q8w | 216 | 1.50 (4.393) |
| guselkumab 100 mg q4w | 211 | 1.68 (7.018) |
a Evaluable subjects have observed change for the specified time period
b SD = standard deviation
Note: no placebo group beyond Week 24
Physical function and health-related quality of life:
In DISCOVER 1 and 2, guselkumab treated patients showed significant improvement (p<0.001) in physical function compared to placebo as assessed by the Health Assessment Questionnaire-Disability Index (HAQ-DI) at Week 24. Improvements in HAQ-DI were maintained from Week 24 to Week 52 in DISCOVER 1 and Week 100 in DISCOVER 2.
A significantly greater improvement from baseline in the SF-36 Physical Component Summary (PCS) score was observed in guselkumab treated patients compared to placebo at Week 24 in DISCOVER 1 (p<0.001 for both dose groups) and DISCOVER 2 (p=0.006 for q4w group). At Week 24, a greater increase from baseline in Functional Assessment of Chronic Illness Therapy-Fatigue (FACIT-F) score was observed in guselkumab treated patients compared to placebo in both studies. In DISCOVER 2, greater improvements in health-related quality of life as measured by the Dermatology Life Quality Index (DLQI) were observed in guselkumab treated patients compared to placebo at Week 24. Improvements in SF-36 PCS, FACIT-F and DLQI scores were maintained from Week 24 to Week 52 in DISCOVER 1 and Week 100 in DISCOVER 2.
Ulcerative colitis
The efficacy and safety of guselkumab were evaluated in three Phase III multicentre, randomised, double-blind, placebo-controlled studies (QUASAR intravenous induction study, QUASAR maintenance study, and ASTRO subcutaneous induction study) in adult patients with moderately to severely active ulcerative colitis who had an inadequate response, loss of response, or intolerance to corticosteroids, conventional immunomodulators (AZA, 6-MP), biologic therapy (TNF blockers, vedolizumab), a Janus kinase (JAK) inhibitor, and/or sphingosine-1-phosphate receptor modulators (S1PRM) applicable only for ASTRO. In addition, efficacy and safety of guselkumab were evaluated in a randomised, double-blind, placebo-controlled, Phase IIb induction dose-finding study (QUASAR induction dose-ranging study) that enrolled a similar ulcerative colitis patient population as the Phase III induction study.
Disease activity was assessed by the modified Mayo score (mMS), a 3-component Mayo score (0-9) which consists of the sum of the following subscores (0 to 3 for each subscore): stool frequency (SFS), rectal bleeding (RBS), and findings on centrally reviewed endoscopy (ES). Moderately to severely active ulcerative colitis was defined as a mMS between 5 and 9, a RBS ≥ 1, and an ES of 2 (defined by marked erythema, absent vascular pattern, friability, and/or erosions) or an ES of 3 (defined by spontaneous bleeding and ulceration).
Induction study: QUASAR IS
In the induction study QUASAR IS, patients were randomised in a 3:2 ratio to receive either guselkumab 200 mg or placebo by intravenous infusion at Week 0, Week 4, and Week 8. A total of 701 patients were evaluated. At baseline the median mMS was 7, with 35.5% of patients having a baseline mMS of 5 to 6 and 64.5% having a mMS of 7 to 9, and 67.9% of patients with a baseline ES of 3. The median age was 39 years (ranging from 18 to 79 years); 43.1% were female; and 72.5% identified as White, 21.4% as Asian and 1% as Black.
Enrolled patients were permitted to use stable doses of oral aminosalicylates, MTX, 6-MP, AZA and/or oral corticosteroids. At baseline, 72.5% of patients were receiving aminosalicylates, 20.8% of patients were receiving immunomodulators (MTX, 6-MP, or AZA), and 43.1% of patients were receiving corticosteroids. Concomitant biologic therapies or JAK inhibitors were not permitted.
A total of 49.1% of patients had previously failed at least one biologic therapy, and/or JAK inhibitor. Of these patients, 87.5%, 54.1% and 18% had previously failed a TNF blocker, vedolizumab or a JAK inhibitor, respectively, and 47.4% had failed treatment with 2 or more of these therapies. A total of 48.4% of patients were biologic and JAK inhibitor naïve, and 2.6% had previously received but had not failed a biologic or JAK inhibitor.
The primary endpoint was clinical remission as defined by the mMS at Week 12. Secondary endpoints at Week 12 included symptomatic remission, endoscopic healing, clinical response, histologic endoscopic mucosal healing, fatigue response and IBDQ remission (Table 13).
Significantly greater proportions of patients were in clinical remission at Week 12 in the guselkumab treated group compared to the placebo group.
Table 13. Proportion of patients meeting efficacy endpoints at Week 12 in QUASAR IS:
| Endpoint | Placebo % | Guselkumab 200 mg intravenous inductiona % | Treatment Difference (95% CI) |
|---|---|---|---|
| Clinical remissionb | |||
| Total population | 8% (N=280) | 23% (N=421) | 15% (10%, 20%)c |
| Biologic and JAK inhibitor naïved | 12% (N=137) | 32% (N=202) | 20% (12%, 28%) |
| Prior biologic and/or JAK inhibitor failuree | 4% (N=136) | 13% (N=208) | 9% (3%, 14%) |
| Symptomatic remissionf | |||
| Total population | 21% (N=280) | 50% (N=421) | 29% (23%, 36%)c |
| Biologic and JAK inhibitor naïved | 26% (N=137) | 60% (N=202) | 34% (24%, 44%) |
| Prior biologic and/or JAK inhibitor failuree | 14% (N=136) | 38% (N=208) | 24% (16%, 33%) |
| Endoscopic healingg | |||
| Total population | 11% (N=280) | 27% (N=421) | 16% (10%, 21%)c |
| Biologic and JAK inhibitor naïved | 17% (N=137) | 38% (N=202) | 21% (12%, 30%) |
| Prior biologic and/or JAK inhibitor failuree | 5% (N=136) | 15% (N=208) | 10% (4%, 16%) |
| Clinical responseh | |||
| Total population | 28% (N=280) | 62% (N=421) | 34% (27%, 41%)c |
| Biologic and JAK inhibitor naïved | 35% (N=137) | 71% (N=202) | 36% (26%, 46%) |
| Prior biologic and/or JAK inhibitor failuree | 20% (N=136) | 51% (N=208) | 32% (22%, 41%) |
| Histologic endoscopic mucosal healingi | |||
| Total Population | 8% (N=280) | 24% (N=421) | 16% (11%, 21%)c |
| Biologic and JAK inhibitor naïved | 11% (N=137) | 33% (N=202) | 22% (13%, 30%) |
| Prior biologic and/or JAK inhibitor failuree | 4% (N=136) | 13% (N=208) | 9% (3%, 15%) |
| Fatigue responsej | |||
| Total population | 21% (N=280) | 41% (N=421) | 20% (13%, 26%)c |
| Biologic and JAK inhibitor naïved | 29% (N=137) | 42% (N=202) | 12% (2%, 23%) |
| Prior biologic and/or JAK inhibitor failuree | 13% (N=136) | 38% (N=208) | 25% (17%, 34%) |
| IBDQ remissionk | |||
| Total population | 30% (N=280) | 51% (N=421) | 22% (15%, 29%)c |
| Biologic and JAK inhibitor naïved | 34% (N=137) | 62% (N=202) | 28% (18%, 38%) |
| Prior biologic and/or JAK inhibitor failuree | 24% (N=136) | 39% (N=208) | 15% (5%, 25%) |
a Guselkumab 200 mg as an intravenous induction at Week 0, Week 4, and Week 8.
b A stool frequency subscore of 0 or 1 and not increased from baseline, a rectal bleeding subscore of 0, and an endoscopy subscore of 0 or 1 with no friability.
c p<0.001, adjusted treatment difference (95% CI) based on Cochran-Mantel-Haenszel method (adjusted for stratification factors: biologic and/or JAK-inhibitor failure status and concomitant use of corticosteroids at baseline).
d An additional 7 patients in the placebo group and 11 patients in the guselkumab group were previously exposed to but did not fail a biologic or JAK inhibitor.
e Includes inadequate response, loss of response, or intolerance to biologic therapy (TNF blockers, vedolizumab) and/or a Janus kinase (JAK) inhibitor for ulcerative colitis.
f A stool frequency subscore of 0 or 1 and not increased from induction baseline, and a rectal bleeding subscore of 0.
g An endoscopy subscore of 0 or 1 with no friability.
h Decrease from induction baseline in the modified Mayo score by ≥30% and ≥2 points, with either a ≥ 1-point decrease from baseline in the rectal bleeding subscore or a rectal bleeding subscore of 0 or 1.
i A combination of histologic healing [neutrophil infiltration in < 5% of crypts, no crypt destruction, and no erosions, ulcerations or granulation tissue according to the Geboes grading system] and endoscopic healing as defined above.
j Fatigue was assessed using the PROMIS-Fatigue Short form 7a. Fatigue response was defined as a ≥7-point improvement from baseline which is considered clinically meaningful.
k Total Inflammatory Bowel Disease Questionnaire score ≥170.
QUASAR IS and QUASAR induction dose-ranging study also enrolled 48 patients with a baseline mMS of 4, including an ES of 2 or 3 and a RBS ≥1. In patients with a baseline mMS of 4, guselkumab efficacy relative to placebo, as measured by clinical remission, clinical response, and endoscopic healing at Week 12, was consistent with the total moderately to severely active ulcerative colitis population.
Rectal bleeding and stool frequency subscores:
Decreases in rectal bleeding and stool frequency subscores were observed as early as Week 2 in patients treated with guselkumab and continued to decrease through Week 12.
Maintenance study: QUASAR MS
The QUASAR MS evaluated 568 patients who achieved clinical response at 12 weeks following the intravenous administration of guselkumab in either QUASAR IS or from the QUASAR induction dose-ranging study. In the QUASAR MS, these patients were randomised to receive a subcutaneous maintenance regimen of either guselkumab 100 mg every 8 weeks, guselkumab 200 mg every 4 weeks or placebo for 44 weeks.
The primary endpoint was clinical remission as defined by mMS at Week 44. Secondary endpoints at Week 44 included but were not limited to symptomatic remission, endoscopic healing, corticosteroid-free clinical remission, histologic endoscopic mucosal healing, fatigue response and IBDQ remission (Table 14).
Significantly greater proportions of patients were in clinical remission at Week 44 in both guselkumab treated groups compared to the placebo.
Table 14. Proportion of patients meeting efficacy endpoints at Week 44 in QUASAR MS:
| Endpoint | Placebo % | Guselkumab 100 mg q8w subcutaneous injectiona % | Guselkumab 200 mg q4w subcutaneous injectionb % | Treatment Difference (95% CI) | |
|---|---|---|---|---|---|
| Guselkumab 100 mg | Guselkumab 200 mg | ||||
| Clinical remissionc | |||||
| Total populationd | 19% (N=190) | 45% (N=188) | 50% (N=190) | 25% (16%, 34%)e | 30% (21%, 38%)e |
| Biologic and JAK- inhibitor naïvef | 26% (N=108) | 50% (N=105) | 58% (N=96) | 24% (12%, 36%) | 29% (17%, 41%) |
| Prior biologic and/or JAK-inhibitor failureg | 8% (N=75) | 40% (N=77) | 40% (N=88) | 30% (19%, 42%) | 32% (21%, 44%) |
| Symptomatic remissionh | |||||
| Total populationd | 37% (N=190) | 70% (N=188) | 69% (N=190) | 32% (23%, 41%)e | 31% (21%, 40%)e |
| Biologic and JAK- inhibitor naïvef | 46% (N=108) | 74% (N=105) | 76% (N=96) | 28% (15%, 40%) | 28% (15%, 41%) |
| Prior biologic and/or JAK-inhibitor failureg | 24% (N=75) | 65% (N=77) | 60% (N=88) | 39% (26%, 52%) | 37% (23%, 50%) |
| Corticosteroid-free clinical remissioni | |||||
| Total populationd | 18% (N=190) | 45% (N=188) | 49% (N=190) | 26% (17%, 34%)e | 29% (20%, 38%)e |
| Biologic and JAK- inhibitor naïvef | 26% (N=108) | 50% (N=105) | 56% (N=96) | 24% (12%, 36%) | 27% (14%, 39%) |
| Prior biologic and/or JAK-inhibitor failureg | 7% (N=75) | 40% (N=77) | 40% (N=88) | 32% (21%, 43%) | 34% (23%, 45%) |
| Endoscopic healingj | |||||
| Total populationd | 19% (N=190) | 49% (N=188) | 52% (N=190) | 30% (21%, 38%)e | 31% (22%, 40%)e |
| Biologic and JAK- inhibitor naïvef | 26% (N=108) | 53% (N=105) | 59% (N=96) | 27% (15%, 40%) | 30% (18%, 42%) |
| Prior biologic and/or JAK-inhibitor failureg | 8% (N=75) | 45% (N=77) | 42% (N=88) | 36% (24%, 48%) | 35% (23%, 46%) |
| Histologic endoscopic mucosal healingk | |||||
| Total populationd | 17% (N=190) | 44% (N=188) | 48% (N=190) | 26% (17%, 34%)e | 30% (21%, 38%)e |
| Biologic and JAK- inhibitor naïvef | 23% (N=108) | 50% (N=105) | 56% (N=96) | 26% (14%, 38%) | 30% (17%, 42%) |
| Prior biologic and/or JAK-inhibitor failureg | 8% (N=75) | 38% (N=77) | 39% (N=88) | 28% (16%, 39%) | 31% (20%, 43%) |
| Clinical responsel | |||||
| Total populationd | 43% (N=190) | 78% (N=188) | 75% (N=190) | 34% (25%, 43%)e | 31% (21%, 40%)e |
| Biologic and JAK- inhibitor naïvef | 54% (N=108) | 83% (N=105) | 81% (N=96) | 29% (17%, 41%) | 26% (14%, 39%) |
| Prior biologic and/or JAK-inhibitor failureg | 28% (N=75) | 70% (N=77) | 67% (N=88) | 41% (27%, 54%) | 39% (26%, 53%) |
| Maintenance of Clinical Remission at Week 44 in patients who achieved clinical remission 12 weeks after induction | |||||
| Total populationq | 34% (N=59) | 61% (N=66) | 72% (N=69) | 26% (9%, 43%)m | 38% (23%, 54%)e |
| Biologic and JAK- inhibitor naïver | 34% (N=41) | 65% (N=43) | 79% (N=48) | 31% (9%, 51%) | 45% (25%, 62%) |
| Prior biologic and/or JAK-inhibitor failureg | 27% (N=15) | 60% (N=20) | 56% (N=18) | 33% (-1%, 62%) | 29% (-6%, 59%) |
| Endoscopic normalisationn | |||||
| Total populationd | 15% (N=190) | 35% (N=188) | 34% (N=190) | 18% (10%, 27%)e | 17% (9%, 25%)e |
| Biologic and JAK- inhibitor naïvef | 20% (N=108) | 38% (N=105) | 42% (N=96) | 17% (6%, 29%) | 17% (6%, 29%) |
| Prior biologic and/or JAK-inhibitor failureg | 8% (N=75) | 31% (N=77) | 24% (N=88) | 21% (10%, 33%) | 16% (6%, 26%) |
| Fatigue response° | |||||
| Total populationd | 29% (N=190) | 51% (N=188) | 43% (N=190) | 20% (11%, 29%)e | 13% (3%, 22%)m |
| Biologic and JAK- inhibitor naïvef | 36% (N=108) | 51% (N=105) | 53% (N=96) | 15% (2%, 28%) | 16% (3%, 29%) |
| Prior biologic and/or JAK-inhibitor failureg | 19% (N=75) | 47% (N=77) | 32% (N=88) | 27% (13%, 40%) | 13% (1%, 26%) |
| IBDQ remissionp | |||||
| Total populationd | 37% (N=190) | 64% (N=188) | 64% (N=190) | 26% (17%, 36%)e | 26% (16%, 35%)e |
| Biologic and JAK- inhibitor naïvef | 49% (N=108) | 68% (N=105) | 74% (N=96) | 19% (6%, 32%) | 24% (11%, 37%) |
| Prior biologic and/or JAK-inhibitor failureg | 19% (N=75) | 58% (N=77) | 53% (N=88) | 38% (26%, 50%) | 35% (23%, 48%) |
a Guselkumab 100 mg as a subcutaneous injection every 8 weeks after the induction regimen.
b Guselkumab 200 mg as a subcutaneous injection every 4 weeks after the induction regimen.
c A stool frequency subscore of 0 or 1 and not increased from baseline, a rectal bleeding subscore of 0, and an endoscopy subscore of 0 or 1 with no friability.
d Patients who achieved clinical response 12 weeks following the intravenous administration of guselkumab in either QUASAR induction study or QUASAR induction dose-ranging study.
e p<0.001, adjusted treatment difference (95% CI) based on Cochran-Mantel-Haenszel method adjusted for randomisation stratification factors.
f An additional 7 patients in the placebo group, 6 patients in the guselkumab 100 mg group, and 6 patients in the guselkumab 200 mg group were previously exposed to but did not fail a biologic or JAK inhibitor.
g Includes inadequate response, loss of response, or intolerance to biologic therapy (TNF blockers, vedolizumab) and/or a Janus kinase [JAK] inhibitor for ulcerative colitis.
h A stool frequency subscore of 0 or 1 and not increased from induction baseline, and a rectal bleeding subscore of 0.
i Not requiring any treatment with corticosteroids for at least 8 weeks prior to Week 44 and also meeting the criteria for clinical remission at Week 44.
j An endoscopy subscore of 0 or 1 with no friability.
k A combination of histologic healing [neutrophil infiltration in <5% of crypts, no crypt destruction, and no erosions, ulcerations or granulation tissue according to the Geboes grading system] and endoscopic healing as defined above.
l Decrease from induction baseline in the modified Mayo score by ≥30% and ≥2 points, with either a ≥1-point decrease from baseline in the rectal bleeding subscore or a rectal bleeding subscore of 0 or 1.
m p<0.01, adjusted treatment difference (95% CI) based on Cochran-Mantel-Haenszel method adjusted for randomisation stratification factors
n An endoscopy subscore of 0.
° Fatigue was assessed using the PROMIS-Fatigue Short form 7a. Fatigue response was defined as a ≥7-point improvement from induction baseline which is considered clinically meaningful.
p Total Inflammatory Bowel Disease Questionnaire score ≥170.
q Subjects who achieved clinical remission 12 weeks following intravenous administration of guselkumab in either QUASAR induction study or QUASAR induction dose-ranging study.
r An additional 3 patients in the placebo group, 3 patients in the guselkumab 100 mg group, and 3 patients in the guselkumab 200 mg group were previously exposed to but did not fail a biologic or JAK inhibitor.
In QUASAR IS and QUASAR MS, the efficacy and safety of guselkumab was consistently demonstrated regardless of age, sex, race, body weight, and previous treatment with a biologic therapy or JAK inhibitor.
In QUASAR MS, patients with high inflammatory burden after completion of induction dosing derived additional benefit from guselkumab 200 mg subcutaneous q4w compared to 100 mg subcutaneous q8w dosing. Clinically meaningful numerical differences of >15% were observed between the two guselkumab dose groups among patients with a CRP level of >3 mg/L after completion of induction dosing for the following endpoints at Week 44: clinical remission (48% 200 mg q4w vs. 30% 100 mg q8w), maintenance of clinical remission (88% 200 mg q4w vs. 50% 100 mg q8w), corticosteroid-free clinical remission (46% 200 mg q4w vs. 30% 100 mg q8w), endoscopic healing (52% 200 mg q4w vs. 35% 100 mg q8w), and histologic-endoscopic mucosal healing (46% 200 mg q4w vs. 29% 100 mg q8w).
QUASAR MS enrolled 31 patients with an induction baseline mMS of 4, including an ES of 2 or 3 and a RBS ≥1 who achieved clinical response 12 weeks following the intravenous administration of guselkumab in QUASAR IS or QUASAR induction dose-ranging study. In these patients, guselkumab efficacy relative to placebo as measured by clinical remission, clinical response, and endoscopic healing at Week 44 was consistent with the total population.
Symptomatic remission over time:
In QUASAR MS symptomatic remission defined as stool frequency subscore of 0 or 1 and not increased from induction baseline, and a rectal bleeding subscore of 0 was sustained through Week 44 in both guselkumab treatment groups, while a decline was observed in the placebo group (Figure 8):
Figure 8. Proportion of patients in symptomatic remission through Week 44 in QUASAR MS:

Week 24 responders to guselkumab extended treatment:
Guselkumab treated patients who were not in clinical response at induction Week 12, received guselkumab 200 mg subcutaneous at Weeks 12, 16 and 20. In QUASAR IS, 66/120 (55%) guselkumab treated patients who were not in clinical response at induction Week 12 achieved clinical response at Week 24. Week 24 responders to guselkumab entered QUASAR MS and received guselkumab 200 mg subcutaneous every 4 weeks. At Week 44 of QUASAR MS, 83/123 (67%) of these patients maintained clinical response and 37/123 (30%) achieved clinical remission.
Recapture of efficacy after loss of response to guselkumab:
Nineteen patients receiving guselkumab 100 mg subcutaneous q8w who experienced a first loss of response (10%) between Week 8 and 32 of QUASAR MS received blinded guselkumab dosing with 200 mg guselkumab subcutaneous q4w and 11 of these patients (58%) achieved symptomatic response and 5 patients (26%) achieved symptomatic remission after 12 weeks.
Histologic and endoscopic assessment:
Histologic remission was defined as a Geboes histologic score ≤2 B.0 (absence of neutrophils from the mucosa [both lamina propria and epithelium], no crypt destruction, and no erosions, ulcerations or granulation tissue according to the Geboes grading system). In QUASAR IS, histologic remission at Week 12 was achieved in 40% of patients treated with guselkumab and 19% of patients in the placebo group. In QUASAR MS, histologic remission at Week 44 was achieved in 59% and 61% of patients treated with guselkumab 100 mg subcutaneous q8w and guselkumab 200 mg subcutaneous q4w and 27% of patients in the placebo group.
Normalisation of the endoscopic appearance of the mucosa was defined as ES of 0. In QUASAR IS, endoscopic normalisation at Week 12 was achieved in 15% of patients treated with guselkumab and 5% of patients in the placebo group.
Composite histologic-endoscopic mucosal outcomes:
Combined symptomatic remission, endoscopic normalisation, histologic remission, and faecal calprotectin ≤250 mg/kg at Week 44 was achieved by a greater proportion of patients treated with guselkumab 100 mg subcutaneous q8w or 200 mg subcutaneous q4w compared to placebo (22% and 28% vs 9%, respectively).
Health-related quality of life:
At Week 12 of QUASAR IS, patients receiving guselkumab showed greater and clinically meaningful improvements from baseline when compared with placebo in inflammatory bowel disease (IBD)-specific quality of life assessed by IBDQ total score, and all IBDQ domain scores (bowel symptoms including abdominal pain and bowel urgency, systemic function, emotional function, and social function). These improvements were maintained in guselkumab treated patients in QUASAR MS through Week 44.
Ulcerative colitis related hospitalisations:
Through Week 12 of QUASAR IS, lower proportions of patients in the guselkumab group compared with the placebo group had ulcerative colitis-related hospitalisations (1.9%, 8/421 vs. 5.4%, 15/280).
ASTRO:
In ASTRO, patients were randomised in a 1:1:1 ratio to receive guselkumab 400 mg subcutaneous induction at Weeks 0, 4 and 8 followed by guselkumab 100 mg subcutaneous maintenance every 8 weeks; or guselkumab 400 mg subcutaneous induction at Weeks 0, 4 and 8, followed by guselkumab 200 mg subcutaneous maintenance every 4 weeks; or placebo.
A total of 418 patients were evaluated. The median age of patients was 40 years (ranging from 18 to 80 years); 38.8% were female; and 64.6% identified as White, 28.9% as Asian, and 3.1% as Black.
Enrolled patients were permitted to use stable doses of oral aminosalicylates, immunomodulators (AZA, 6-MP, MTX), and/or oral corticosteroids (up to 20 mg/day prednisone or equivalent). At baseline, 77.3% of patients were receiving aminosalicylates, 20.1% of patients were receiving immunomodulators, and 32.8% of patients were receiving corticosteroids. Concomitant biologic therapies, JAK inhibitors, or S1PRMs were not permitted. A total of 40.2% of patients had previously failed treatment with at least one biologic therapy, JAK inhibitor, and/or S1PRM, 58.1% were biologic, JAK inhibitor, and S1PRM naïve, and 1.7% had previously received but had not failed a biologic, JAK inhibitor, or S1PRM.
In ASTRO, the primary endpoint was clinical remission at Week 12 as defined by the mMS. Secondary endpoints at Week 12 included symptomatic remission, endoscopic healing, clinical response and histologic-endoscopic mucosal healing (see Table 15). Secondary endpoints at Week 24 included clinical remission and endoscopic healing (see Table 16).
Table 15. Proportion of patients meeting efficacy endpoints at Week 12 in ASTRO:
| Endpoint | Placebo % | Guselkumab 400 mg Subcutaneous Inductiona % | Treatment Difference vs Placebo (95% CI)b |
|---|---|---|---|
| Clinical remissionc | |||
| Total Population | 6% (N=139) | 28% (N=279) | 21% (15%, 28%)e |
| Biologic, JAK-inhibitor, and S1PRM naïvef | 9% (N=79) | 36% (N=164) | 27% (18%, 37%) |
| Prior biologic, JAK-inhibitor, and/or S1PRM failureg | 4% (N=56) | 16% (N=112) | 12% (3%, 20%) |
| Symptomatic remissiond | |||
| Total Population | 21% (N=139) | 51% (N=279) | 30% (22%, 39%)e |
| Biologic, JAK-inhibitor, and S1PRM naïvef | 25% (N=79) | 59% (N=164) | 34% (22%, 46%) |
| Prior biologic, JAK-inhibitor, and/or S1PRM failureg | 14% (N=56) | 41% (N=112) | 26% (13%, 39%) |
| Endoscopic healingh | |||
| Total Population | 13% (N=139) | 37% (N=279) | 24% (17%, 32%)e |
| Biologic, JAK-inhibitor, and S1PRM naïvef | 18% (N=79) | 46% (N=164) | 28% (17%, 40%) |
| Prior biologic, JAK-inhibitor, and/or S1PRM failureg | 7% (N=56) | 24% (N=112) | 16% (6%, 26%) |
| Clinical responsei | |||
| Total Population | 35% (N=139) | 66% (N=279) | 31% (22%, 40%)e |
| Biologic, JAK-inhibitor, and S1PRM naïvef | 42% (N=79) | 71% (N=164) | 30% (17%, 43%) |
| Prior biologic, JAK-inhibitor, and/or S1PRM failureg | 25% (N=56) | 57% (N=112) | 31% (17%, 45%) |
| Histologic endoscopic mucosal healingj | |||
| Total Population | 11% (N=139) | 30% (N=279) | 20% (12%, 27%)e |
| Biologic, JAK-inhibitor, and S1PRM naïvef | 14% (N=79) | 38% (N=164) | 25% (14%, 35%) |
| Prior biologic, JAK-inhibitor, and/or S1PRM failureg | 7% (N=56) | 19% (N=112) | 11% (1%, 20%) |
a Guselkumab 400 mg subcutaneous induction at Week 0, Week 4, and Week 8
b The adjusted treatment difference and the CIs were based on the common risk difference by use of Mantel-Haenszel stratum weights and Sato variance estimator. The stratification variables used were prior biologic, JAK inhibitor, and/or S1PRM failure status (Yes or No), and Mayo endoscopy subscore at baseline (moderate [2] or severe [3]).
c A stool frequency subscore of 0 or 1 and not increased from baseline, a rectal bleeding subscore of 0, and an endoscopy subscore of 0 or 1 with no friability
d A stool frequency subscore of 0 or 1 and not increased from induction baseline, and a rectal bleeding subscore of 0
e p < 0.001
f An additional 4 patients in the placebo group and 3 patients in the guselkumab group were previously exposed to but did not fail a biologic, JAK inhibitor or S1PRM
g Includes inadequate response, loss of response, or intolerance to biologic therapy (TNF blockers, vedolizumab), JAK inhibitor, and/or S1PRM for ulcerative colitis
h An endoscopy subscore of 0, or 1 with no friability
i Decrease from baseline in the modified Mayo score by ≥ 30% and ≥ 2 points, with either a ≥ 1 point decrease from baseline in the rectal bleeding subscore or a rectal bleeding subscore of 0 or 1
j An endoscopy subscore of 0, or 1 with no friability and Geboes score ≤ 3.1 (indicating neutrophil infiltration in < 5% of crypts, no crypt destruction, and no erosions, ulcerations, or granulation tissue)
Table 16. Proportion of patients meeting efficacy endpoints at Week 24 in ASTRO:
| Endpoint | Placebo % | Guselkumab 400 mg SC induction→ 100 mg q8w Subcutaneous Injectiona % | Guselkumab 400 mg SC induction→ 200 mg q4w Subcutaneous Injectionb % | Treatment Difference vs Placebo (95% CI)c | |
|---|---|---|---|---|---|
| Guselkumab 100 mg | Guselkumab 200 mg | ||||
| Clinical remissiond | |||||
| Total population | 9% (N=139) | 35% (N=139) | 36% (N=140) | 26% (17%, 35%)e | 27% (18%, 36%)e |
| Biologic, JAK- inhibitor, and S1PRM naïvef | 13% (N=79) | 49% (N=81) | 43% (N=83) | 37% (24%, 50%) | 31% (18%, 44%) |
| Prior biologic, JAK-inhibitor, and/or S1PRM failureg | 5% (N=56) | 16% (N=57) | 27% (N=55) | 10% (-1%, 21%) | 21% (9%, 34%) |
| Endoscopic healingh | |||||
| Total population | 12% (N=139) | 40% (N=139) | 45% (N=140) | 28% (18%, 38%)e | 33% (23%, 42%)e |
| Biologic, JAK- inhibitor, and S1PRM naïvef | 18% (N=79) | 54% (N=81) | 52% (N=83) | 37% (23%, 51%) | 34% (21%, 48%) |
| Prior biologic, JAK-inhibitor, and/or S1PRM failureg | 5% (N=56) | 19% (N=57) | 36% (N=55) | 13% (1%, 25%) | 30% (17%, 44%) |
a Guselkumab 400 mg SC induction at Weeks 0, 4 and 8 followed by guselkumab 100 mg SC maintenance every 8 weeks
b Guselkumab 400 mg SC induction at Weeks 0, 4 and 8, followed by guselkumab 200 mg SC maintenance every 4 weeks
c The adjusted treatment difference and the CIs were based on the common risk difference by use of Mantel-Haenszel stratum weights and Sato variance estimator. The stratification variables used were prior biologic, JAK inhibitor, and/or S1PRM failure status (Yes or No), and Mayo endoscopy subscore at baseline (moderate [2] or severe [3]).
d A stool frequency subscore of 0 or 1 and not increased from baseline, a rectal bleeding subscore of 0, and an endoscopy subscore of 0, or 1 with no friability
e p < 0.001
f An additional 4 patients in the placebo group, 1 patient in the guselkumab 100 mg group, and 2 patients in the guselkumab 200 mg group were previously exposed to but did not fail a biologic, JAK inhibitor or S1PRM
g Includes inadequate response, loss of response, or intolerance to biologic therapy (TNF blockers, vedolizumab), JAK inhibitor, and/or S1PRM for ulcerative colitis
h An endoscopy subscore of 0, or 1 with no friability
Symptomatic remission over time:
In ASTRO, symptomatic remission defined as stool frequency subscore of 0 or 1 and not increased from baseline, and a rectal bleeding subscore of 0 observed through Week 12, a greater proportion of patients in the guselkumab treatment groups achieved symptomatic remission compared with the placebo group (Figure 9):
Figure 9. Proportion of patients in symptomatic remission through Week 12 in ASTRO:

Rectal bleeding and stool frequency subscores
Decreases in rectal bleeding and stool frequency subscores were observed as early as Week 2 in patients treated with guselkumab compared to placebo.
Histologic and endoscopic assessment
Histologic remission at Week 12 was achieved in 44% of patients treated with guselkumab 400 mg subcutaneous induction compared to 20% of patients on placebo.
Endoscopic normalisation at Week 24 was achieved in 21% and 26% of patients treated with guselkumab 400 mg subcutaneous induction, followed by guselkumab 100 mg administered by subcutaneous injection at Week 16, and every 8 weeks thereafter, or guselkumab 200 mg administered by subcutaneous injection at Week 12, and every 4 weeks thereafter, respectively, compared to 4% of patients on placebo.
Abdominal pain and bowel urgency
A greater proportion of patients treated with guselkumab 400 mg subcutaneous induction compared to placebo had no abdominal pain (56% vs 31%), and no bowel urgency (49% vs 24%) at Week 12.
Health-related quality of life
Disease-specific health-related quality of life was assessed with the IBDQ. A greater proportion of patients in the combined 400 mg SC guselkumab group (61%) achieved IBDQ remission at Week 12 compared with the placebo group (34%).
Crohn's disease
The efficacy and safety of guselkumab were evaluated in three Phase III clinical studies in adult patients with moderately to severely active Crohn's disease who had an inadequate response, loss of response or intolerance to either oral corticosteroids, conventional immunomodulators (AZA, 6-MP, MTX) and/or biologic therapy (TNF blocker or vedolizumab): two identically designed 48-Week multicentre, randomised, double-blind, placebo- and active-controlled (ustekinumab), parallel group studies (GALAXI 2 and GALAXI 3) and one 24-Week multicentre, randomised, double-blind, placebo-controlled, parallel group study (GRAVITI). All three studies had a treat-through study design: patients randomised to guselkumab (or ustekinumab for GALAXI 2 and GALAXI 3) maintained that treatment assignment for the duration of the study.
GALAXI 2 and GALAXI 3
In the Phase III studies GALAXI 2 and GALAXI 3, moderately to severely active Crohn's disease was defined as a Crohn's Disease Activity Index [CDAI] score of ≥220 and ≤450 and a Simple Endoscopic Score for CD (SES-CD) of ≥6 (or ≥4 for patients with isolated ileal disease). Additional criteria for GALAXI ⅔ included a mean daily stool frequency (SF) >3 or mean daily abdominal pain score (AP) >1.
In GALAXI 2 and GALAXI 3 studies, patients were randomised in a 2:2:2:1 ratio to receive guselkumab 200 mg intravenous induction at Weeks 0, 4 and 8 followed by guselkumab 200 mg subcutaneous q4w maintenance; or guselkumab 200 mg intravenous induction at Weeks 0, 4 and 8, followed by guselkumab 100 mg subcutaneous q8w maintenance; or ustekinumab approximately 6 mg/kg intravenous induction at Week 0 followed by ustekinumab 90 mg subcutaneous q8w maintenance; or placebo. Placebo non-responders received ustekinumab starting at Week 12.
A total of 1021 patients were evaluated in GALAXI 2 (n=508) and GALAXI 3 (n=513). The median age was 34 years (ranging from 18 to 83 years), 57.6% were male; and 74.3% identified as White, 21.3% as Asian and 1.5% as Black.
In GALAXI 2, 52.8% of patients had previously failed treatment with at least one biologic therapy (50.6% were intolerant or failed at least 1 prior anti-TNFα therapy, 7.5% were intolerant or failed prior vedolizumab therapy), 41.9% were biologic naïve, and 5.3% had previously received but had not failed a biologic. At baseline, 37.4% of the patients were receiving oral corticosteroids and 29.9% of the patients were receiving conventional immunomodulators.
In GALAXI 3, 51.9% of patients had previously failed treatment with at least one biologic therapy (50.3% were intolerant or failed at least 1 prior anti-TNFα therapy, 9.6% were intolerant or failed prior vedolizumab therapy), 41.5% were biologic naïve, and 6.6% had previously received but had not failed a biologic. At baseline, 36.1% of the patients were receiving oral corticosteroids and 30.2% of the patients were receiving conventional immunomodulators.
The results of the co-primary and major secondary endpoints compared to placebo in GALAXI 2 and GALAXI 3 are presented in Tables 17 (Week 12) and 18 (Week 48). The results of the major secondary endpoints at Week 48 compared to ustekinumab are presented in Tables 19 and 20.
Table 17. Proportion of patients meeting co-primary and major secondary efficacy endpoints with guselkumab versus placebo at Week 12 in GALAXI 2 and GALAXI 3:
| GALAXI 2 | GALAXI 3 | |||
|---|---|---|---|---|
| Placebo % | Guselkumab intravenous inductiona % | Placebo % | Guselkumab intravenous inductiona % | |
| Co-primary efficacy endpoints | ||||
| Clinical remissionb at Week 12 | ||||
| Total population | 22% (N=76) | 47%i (N=289) | 15% (N=72) | 47%i (N=293) |
| Biologic naïvec | 18% (N=34) | 50% (N=121) | 15% (N=27) | 50% (N=123) |
| Prior biologic failured | 23% (N=39) | 45% (N=150) | 15% (N=39) | 47% (N=150) |
| Endoscopic responsee at Week 12 | ||||
| Total population | 11% (N=76) | 38%i (N=289) | 14% (N=72) | 36%i (N=293) |
| Biologic naïvec | 15% (N=34) | 51% (N=121) | 22% (N=27) | 41% (N=123) |
| Prior biologic failured | 5% (N=39) | 27% (N=150) | 8% (N=39) | 31% (N=150) |
| Major secondary efficacy endpoints | ||||
| PRO-2 remissionf at Week 12 | ||||
| Total population | 21% (N=76) | 43%i (N=289) | 14% (N=72) | 42%i (N=293) |
| Biologic naïvec | 24% (N=34) | 43% (N=121) | 15% (N=27) | 47% (N=123) |
| Prior biologic failured | 13% (N=39) | 41% (N=150) | 13% (N=39) | 39% (N=150) |
| Fatigue responseg at Week 12 | ||||
| Total population | 29% (N=76) | 45%j (N=289) | 18% (N=72) | 43%i (N=293) |
| Biologic naïvec | 32% (N=34) | 48% (N=121) | 19% (N=27) | 46% (N=123) |
| Prior biologic failured | 26% (N=39) | 41% (N=150) | 18% (N=39) | 43% (N=150) |
| Endoscopic remissionh at Week 12 | ||||
| Total population | 1% (N=76) | 15% (N=289) | 8% (N=72) | 16% (N=293) |
| Biologic naïvec | 3% (N=34) | 22% (N=121) | 19% (N=27) | 25% (N=123) |
| Prior biologic failured | 0% (N=39) | 9% (N=150) | 0% (N=39) | 9% (N=150) |
a Guselkumab 200 mg intravenous induction at Week 0, Week 4 and Week 8 – Two guselkumab treatment groups were combined for this column as patients received the same intravenous induction dose regimen prior to Week 12.
b Clinical remission is defined as CDAI score <150.
c An additional 9 patients in the placebo group and 38 patients in the guselkumab 200 mg intravenous group were previously exposed to but did not fail a biological therapy.
d Includes inadequate response, loss of response, or intolerance to biologic therapy (TNF blockers or vedolizumab) for Crohn's disease.
e Endoscopic response is defined as ≥50% improvement from baseline in SES-CD score or SES-CD Score ≤2.
f PRO-2 remission is defined as AP mean daily score at or below 1 and SF mean daily score at or below 3, and no worsening of AP or SF from baseline.
g Fatigue response is defined as improvement of ≥7 points in PROMIS Fatigue Short Form 7a.
h Endoscopic remission is defined as SES-CD Score ≤2.
i p<0.001
j p<0.05
Table 18. Proportion of patients meeting major secondary efficacy endpoints with guselkumab versus placebo at Week 48 in GALAXI 2 and GALAXI 3:
| GALAXI 2 | GALAXI 3 | |||||
|---|---|---|---|---|---|---|
| Placebo | Guselkumab intravenous induction→ 100 mg q8w subcutaneous injectiona | Guselkumab intravenous induction→ 200 mg q4w subcutaneous injectionb | Placebo (N=72) | Guselkumab intravenous induction→ 100 mg q8w subcutaneous injectiona | Guselkumab intravenous induction→ 200 mg q4w subcutaneous injectionb | |
| Corticosteroid-free clinical remissionc at Week 48f | ||||||
| Total population | 12% (N=76) | 45%e (N=143) | 51%e (N=146) | 14% (N=72) | 44%e (N=143) | 48%e (N=150) |
| Endoscopic responsed at Week 48f | ||||||
| Total population | 7% (N=76) | 38 %e (N=143) | 38%e (N=146) | 6% (N=72) | 33%e (N=143) | 36%e (N=150) |
Table 19. Proportion of patients meeting major secondary efficacy endpoints with guselkumab versus ustekinumab at Week 48 in GALAXI 2 and GALAXI 3:
| GALAXI 2 | GALAXI 3 | |||||
|---|---|---|---|---|---|---|
| Ustekinumab 6 mg/kg intravenous induction→ 90 mg q8w subcutaneous injectiona | Guselkumab intravenous induction→ 100 mg q8w subcutaneous injectionb | Guselkumab intravenous induction→ 200 mg q4w subcutaneous injectionc | Ustekinumab 6 mg/kg intravenous induction→ 90 mg q8w subcutaneous injectiona | Guselkumab intravenous induction→ 100 mg q8w subcutaneous injectionb | Guselkumab intravenous induction→ 200 mg q4w subcutaneous injectionc | |
| Clinical remission at Week 48 and endoscopic responsed at Week 48 | ||||||
| Total population | 39% (N=143) | 42% (N=143) | 49% (N=146) | 28% (N=148) | 41%k (N=143) | 45%k (N=150) |
| Endoscopic responsee at Week 48l | ||||||
| Total population | 42% (N=143) | 49% (N=143) | 56% (N=146) | 32% (N=148) | 47% (N=143) | 49% (N=150) |
| Endoscopic remissionf at Week 48 | ||||||
| Total population | 20% (N=143) | 27% (N=143) | 24% (N=146) | 13% (N=148) | 24%k (N=143) | 19% (N=150) |
| Clinical remissiong at Week 48 | ||||||
| Total population | 65% (N=143) | 64% (N=143) | 75% (N=146) | 61% (N=148) | 66% (N=143) | 66% (N=150) |
| Corticosteroid-free clinical remissionh at Week 48l | ||||||
| Total population | 61% (N=143) | 63% (N=143) | 71% (N=146) | 59% (N=148) | 64% (N=143) | 64% (N=150) |
| Durable clinical remissioni at Week 48 | ||||||
| Total population | 45% (N=143) | 46% (N=143) | 52% (N=146) | 39% (N=148) | 50% (N=143) | 49% (N=150) |
| PRO-2 remissionj at Week 48 | ||||||
| Total population | 59% (N=143) | 60% (N=143) | 69% (N=146) | 53% (N=148) | 58% (N=143) | 56% (N=150) |
a Ustekinumab 6 mg/kg intravenous induction at Week 0 followed by ustekinumab 90 mg subcutaneous q8w thereafter for up to 48 weeks.
b Guselkumab 200 mg intravenous induction at Week 0, Week 4 and Week 8 followed by guselkumab 100 mg subcutaneous q8w thereafter for up to 48 weeks.
c Guselkumab 200 mg intravenous induction at Week 0, Week 4 and Week 8 followed by guselkumab 200 mg subcutaneous q4w thereafter for up to 48 weeks.
d A combination of clinical remission and endoscopic response as defined below.
e Endoscopic response is defined as ≥50% improvement from baseline in SES-CD score or SES-CD Score ≤2.
f Endoscopic remission is defined as SES-CD Score ≤2.
g Clinical remission is defined as CDAI score <150.
h Corticosteroid-free clinical remission is defined as CDAI score <150 at Week 48 and not receiving corticosteroids at Week 48.
i Durable clinical remission is defined as CDAI <150 for ≥80% of all visits between Week 12 and Week 48 (at least 8 of 10 visits), which must include Week 48.
j PRO-2 remission is defined as AP mean daily score at or below 1 and SF mean daily score at or below 3, and no worsening of AP or SF from baseline.
k p<0.05
l Responses at Week 48 were evaluated irrespective of clinical response at Week 12
Table 20. Proportion of patients meeting efficacy endpoints with guselkumab versus ustekinumab at Week 48 in pooled GALAXI 2 and GALAXI 3:
| Ustekinumab 6 mg/kg intravenous induction → 90 mg q8w subcutaneous injectiona | Guselkumab intravenous induction → 100 mg q8w subcutaneous injectionb | Guselkumab intravenous induction → 200 mg q4w subcutaneous injectionc | |
|---|---|---|---|
| Clinical remission at Week 48 and endoscopic responsed at Week 48 | |||
| Total population | 34% (N=291) | 42% (N=286) | 47% (N=296) |
| Biologic naïvee | 43% (N=121) | 51% (N=116) | 55% (N=128) |
| Prior biologic failuref | 26% (N=156) | 37% (N=153) | 41% (N=147) |
| Endoscopic responseg at Week 48 | |||
| Total population | 37% (N=291) | 48% (N=286) | 53% (N=296) |
| Biologic naïvee | 43% (N=121) | 59% (N=116) | 59% (N=128) |
| Prior biologic failuref | 31% (N=156) | 43% (N=153) | 47% (N=147) |
| Endoscopic remissionh at Week 48 | |||
| Total population | 16% (N=291) | 25% (N=286) | 21% (N=296) |
| Biologic naïvee | 19% (N=121) | 34% (N=116) | 27% (N=128) |
| Prior biologic failuref | 13% (N=156) | 21% (N=153) | 14% (N=147) |
| Clinical remissioni at Week 48 | |||
| Total population | 63% (N=291) | 65% (N=286) | 70% (N=296) |
| Biologic naïvee | 75% (N=121) | 73% (N=116) | 77% (N=128) |
| Prior biologic failuref | 53% (N=156) | 61% (N=153) | 64% (N=147) |
a Ustekinumab 6 mg/kg intravenous induction at Week 0 followed by ustekinumab 90 mg subcutaneous q8w thereafter for up to 48 weeks.
b Guselkumab 200 mg intravenous induction at Week 0, Week 4 and Week 8 followed by guselkumab 100 mg subcutaneous q8w thereafter for up to 48 weeks.
c Guselkumab 200 mg intravenous induction at Week 0, Week 4 and Week 8 followed by guselkumab 200 mg subcutaneous q4w thereafter for up to 48 weeks.
d A combination of clinical remission and endoscopic response as defined below.
e An additional 14 patients in the ustekinumab group, 21 patients in the guselkumab 200 mg subcutaneous q4w group, and 17 patients in the guselkumab 100 mg subcutaneous q8w group were previously exposed to but did not fail a biological therapy.
f Includes inadequate response, loss of response, or intolerance to biologic therapy (TNF blockers, vedolizumab) for Crohn's disease.
g Endoscopic response is defined as ≥50% improvement from baseline in SES-CD score or SES-CD Score ≤2.
h Endoscopic remission is defined as SES-CD Score ≤2.
i Clinical remission is defined as CDAI score <150.
In GALAXI 2 and GALAXI 3, the efficacy and safety of guselkumab was consistently demonstrated regardless of age, sex, race and body weight.
In the pooled GALAXI Phase III studies subpopulation analysis, patients with high inflammatory burden after completion of induction dosing derived additional benefit from guselkumab 200 mg subcutaneous q4w compared to the 100 mg subcutaneous q8w maintenance dose regimens. A clinically meaningful difference was observed between the two guselkumab dose groups among patients with a CRP level of >5 mg/L after completion of induction, for the endpoints of clinical remission at Week 48 (100 mg subcutaneous q8w: 54.1% vs 200 mg subcutaneous q4w: 71.0%); endoscopic response at Week 48 (100 mg subcutaneous q8w: 36.5% vs 200 mg subcutaneous q4w: 50.5%); and PRO-2 remission at Week 48 (100 mg subcutaneous q8w: 51.8% vs 200 mg subcutaneous q4w: 61.7%).
Clinical remission over time:
CDAI scores were recorded at each patient visit. The proportion of patients in clinical remission through Week 48 is presented in Figure 10.
Figure 10. Proportion of patients in clinical remission through Week 48 in pooled GALAXI 2 and GALAXI 3:

Health-related quality of life:
Greater improvements from baseline were seen at Week 12 in guselkumab treatment groups when compared with placebo for inflammatory bowel disease (IBD)-specific quality of life assessed by IBDQ total score. The improvements were maintained through Week 48 in both studies.
GRAVITI
In the Phase III GRAVITI study, moderately to severely active Crohn's disease was defined as a CDAI score of ≥220 and ≤450 and a CD (SES-CD) of ≥6 (or ≥4 for patients with isolated ileal disease) and a mean daily SF ≥4 or mean daily AP score ≥2.
In GRAVITI, patients were randomised in a 1:1:1 ratio to receive guselkumab 400 mg subcutaneous induction at Weeks 0, 4 and 8 followed by guselkumab 100 mg q8w subcutaneous maintenance; or guselkumab 400 mg subcutaneous induction at Weeks 0, 4 and 8, followed by guselkumab 200 mg q4w subcutaneous maintenance; or placebo. All patients in the placebo group who met rescue criteria received the induction dosing with guselkumab 400 mg subcutaneous at Weeks 16, 20, and 24 followed by guselkumab 100 mg subcutaneous q8w.
A total of 347 patients were evaluated. The median age of patients was 36 years (ranging from 18 to 83 years), 58.5% were male, and 66% identified as White, 21.9% as Asian and 2.6% as Black.
In GRAVITI, 46.4% of patients had previously failed treatment with at least one biologic therapy, 46.4% were biologic naïve, and 7.2% had previously received but had not failed a biologic. At baseline, 29.7% of the patients were receiving oral corticosteroids and 28.5% of the patients were receiving conventional immunomodulators.
The results of the co-primary and major secondary efficacy endpoints compared to placebo at Week 12 are presented in Table 21.
Table 21. Proportion of patients meeting co-primary and major secondary efficacy endpoints with guselkumab versus placebo at Week 12 in GRAVITI:
| Placebo | Guselkumab 400 mg subcutaneous injectiona | |
|---|---|---|
| Co-primary efficacy endpoints | ||
| Clinical remissionb at Week 12 | ||
| Total population | 21% (N=117) | 56%c (N=230) |
| Biologic naïved | 25% (N=56) | 50% (N=105) |
| Prior biologic failuree | 17% (N=53) | 60% (N=108) |
| Endoscopic responsef at Week 12 | ||
| Total population | 21% (N=117) | 41%c (N=230) |
| Biologic naïved | 27% (N=56) | 49% (N=105) |
| Prior biologic failuree | 17% (N=53) | 33% (N=108) |
| Major secondary efficacy endpoints | ||
| Clinical responseg at Week 12 | ||
| Total population | 33% (N=117) | 73%c (N=230) |
| Biologic naïved | 38% (N=56) | 68% (N=105) |
| Prior biologic failuree | 28% (N=53) | 78% (N=108) |
| PRO-2 remissionh at Week 12 | ||
| Total population | 17% (N=117) | 49%c (N=230) |
| Biologic naïved | 18% (N=56) | 44% (N=105) |
| Prior biologic failuree | 17% (N=53) | 52% (N=108) |
a Guselkumab 400 mg subcutaneous at Week 0, Week 4 and Week 8
b Clinical remission: CDAI score <150
c p<0.001
d An additional 8 patients in the placebo group and 17 patients in the guselkumab 400 mg subcutaneous group, were previously exposed to but did not fail a biological therapy.
e Includes inadequate response, loss of response, or intolerance to biologic therapy (TNF blockers, vedolizumab) for Crohn's disease.
f Endoscopic response: ≥50% improvement from baseline in SES-CD score.
g Clinical response: ≥100-point reduction from baseline in CDAI score or CDAI score <150.
h PRO-2 remission: AP mean daily score at or below 1 and SF mean daily score at or below 3, and no worsening of AP or SF from baseline.
Clinical remission at Week 24 was achieved by a significantly greater proportion of patients treated with guselkumab 400 mg subcutaneous induction followed by guselkumab 100 mg subcutaneous q8w or 200 mg subcutaneous q4w compared to placebo (60.9% and 58.3% vs 21.4% respectively, both p-values <0.001). Clinical remission at Week 48 was achieved by 60% and 66.1% of patients treated with guselkumab 400 mg subcutaneous induction followed by guselkumab 100 mg subcutaneous q8w or 200 mg subcutaneous q4w, respectively (both p-values <0.001 compared to placebo).
Endoscopic response at Week 48 was achieved by 44.3% and 51.3% of patients treated with guselkumab 400 mg subcutaneous induction followed by guselkumab 100 mg subcutaneous q8w or 200 mg subcutaneous q4w, respectively (both p-values <0.001 compared to placebo).
Health-related quality of life:
In GRAVITI, clinically meaningful improvements were observed in IBD-specific quality of life as assessed with IBDQ total score at Week 12 and Week 24 compared to placebo.
Paediatric population
The European Medicines Agency has deferred the obligation to submit the results of studies with guselkumab in one or more subsets of the paediatric population in psoriatic arthritis, ulcerative colitis, and Crohn's disease (see section 4.2 for information on paediatric use).
Paediatric plaque psoriasis
The safety and efficacy of guselkumab were assessed in one multicentre, randomised, placebo- and active biological comparator-controlled study (PROTOSTAR) in 120 paediatric patients 6 to 17 years of age with moderate to severe plaque psoriasis who were candidates for phototherapy or systemic therapy and were inadequately controlled by phototherapy and/or topical therapies. PROTOSTAR was conducted in two parts. Part 1 consisted of a 16-week randomised, placebo and active comparator-controlled period followed by an uncontrolled period of withdrawal and retreatment or initiation of treatment with guselkumab through Week 52. Part 2 consisted of an open-label guselkumab arm through Week 52.
Enrolled patients had an IGA score of ≥3 on a 5-point scale of overall disease severity, a PASI ≥12, and a minimum affected BSA of ≥10%, and at least one of the following: 1) very thick lesions, 2) clinically relevant facial, genital, or hand/foot involvement, 3) PASI ≥20, 4) BSA >20%, or 5) IGA=4. Subjects with guttate, erythrodermic, or pustular psoriasis were excluded.
In Part 1, 92 patients 6 to 17 years of age were randomised to receive subcutaneous injection of either guselkumab (n=41) or placebo (n=25) at Week 0, 4, and 12, or an active biological comparator (n=26) weekly. In Part 2, 28 additional adolescent patients 12 to 17 years of age were enrolled to receive subcutaneous injection of guselkumab at Week 0, 4, and every 8 weeks thereafter. In the guselkumab group, patients with a body weight less than 70 kg received 1.3 mg/kg administered with the 45 mg/0.45 mL pre-filled pen, and patients with a body weight of 70 kg or more received 100 mg administered with the pre-filled syringe.
The co-primary endpoints were the proportion of patients who achieved a PASI 75 response and the proportion of patients who achieved an IGA score of 0 ("cleared") or 1 ("minimal") at Week 16. Secondary endpoints included but were not limited to the proportion of patients who achieved a PASI 90 response, an IGA score of 0 ("cleared") or a PASI 100 response at Week 16.
Of the 92 patients in the controlled part of the study, baseline demographic characteristics were generally comparable across treatment groups. Overall, over 55% were male, 85% were white, the mean body weight was approximately 57.3 kg, and the mean age was 12.9 years with 33% of the patients less than 12 years.
The baseline disease characteristics were generally comparable across treatment groups with median baseline BSA of 20%, median baseline PASI score of approximately 17, and baseline IGA score of severe for 20% (placebo) and 24% (guselkumab) of patients, and a history of psoriatic arthritis for 3.3% of patients.
Overall skin disease:
Treatment with guselkumab resulted in significant improvements in the outcome measures of disease activity compared to placebo at Week 16. The key efficacy results for the study endpoints are shown in Table 22 below.
Table 22. Summary of endpoints at week 16 in PROTOSTAR:
| Placebo (N=25) | Guselkumab (N=41) | P-value | |
|---|---|---|---|
| IGA scores of cleared (0) or minimal (1), n (%) | 4 (16.0%) | 27 (65.9%) | <0.001 |
| IGA scores of cleared (0), n (%) | 1 (4.0%) | 16 (39.0%) | 0.004 |
| PASI 75 responders, n (%) | 5 (20.0%) | 31 (75.6%) | <0.001 |
| PASI 90 responders, n (%) | 4 (16.0%) | 23 (56.1%) | 0.003 |
| PASI 100 responders, n (%) | 0 | 14 (34.1%) | 0.002 |
| Change from baseline in CDLQI, LSMean (95% CI)a | -1.88 (-3.81, 0.05) | -7.28 (-8.87, -5.68) | <0.001 |
CDLQI = Children's Dermatology Life Quality Index
a LSMean = least squares mean
Beyond the 16-week placebo-controlled period in Part 1 of PROTOSTAR, the guselkumab treated patients who achieved PASI 90 at Week 16 were withdrawn from treatment. Loss of PASI 90 response was noted as early as 12 weeks after withdrawal of guselkumab treatment with a median time to loss of PASI 90 response of approximately 24 weeks. Of the guselkumab treated patients who failed to achieve a PASI 90 response at Week 16, 72.2% of patients that received an additional 32 weeks of continued guselkumab treatment were PASI 75 responders at Week 52, and 61.1% achieved a PASI 90 response at Week 52.
In patients randomised to placebo at Week 0 who failed to achieve a PASI 90 response at Week 16 and crossed over to receive guselkumab 95.0% and 65.0% achieved PASI 75 and PASI 90 response, respectively, at Week 52.
Pharmacokinetic properties
Absorption
Following a single 100 mg subcutaneous injection in healthy subjects, guselkumab reached a mean (± SD) maximum serum concentration (Cmax) of 8.09 ± 3.68 mcg/mL by approximately 5.5 days post dose. The absolute bioavailability of guselkumab following a single 100 mg subcutaneous injection was estimated to be approximately 49% in healthy subjects.
In patients with plaque psoriasis, following subcutaneous administrations of guselkumab 100 mg at Weeks 0 and 4, and every 8 weeks thereafter, steady-state serum guselkumab concentrations were achieved by Week 20. The mean (± SD) steady-state trough serum guselkumab concentrations in two Phase III studies in patients with plaque psoriasis were 1.15 ± 0.73 mcg/mL and 1.23 ± 0.84 mcg/mL. The pharmacokinetics of guselkumab in patients with psoriatic arthritis was similar to that in patients with psoriasis. Following subcutaneous administration of guselkumab 100 mg at Weeks 0, 4, and every 8 weeks thereafter, mean steady-state trough serum guselkumab concentration was also approximately 1.2 mcg/mL. Following subcutaneous administration of guselkumab 100 mg every 4 weeks, mean steady-state trough serum guselkumab concentration was approximately 3.8 mcg/mL.
The pharmacokinetics of guselkumab were similar in patients with ulcerative colitis and Crohn's disease. Following the recommended intravenous induction dose regimen of guselkumab 200 mg at Weeks 0, 4, and 8, mean peak serum guselkumab concentration at Week 8 was 68.27 mcg/mL in patients with ulcerative colitis, and 70.5 mcg/mL in patients with Crohn's disease.
Following the recommended subcutaneous induction dose regimen of guselkumab 400 mg at Weeks 0, 4, and 8, mean peak serum guselkumab concentration at Week 8 was estimated to be 28.8 mcg/mL in patients with ulcerative colitis, and 27.7 mcg/mL in patients with Crohn's disease. The total systemic exposure (AUC) after the recommended induction dose regimen was similar following subcutaneous and intravenous induction.
Following subcutaneous maintenance dosing of guselkumab 100 mg every 8 weeks or guselkumab 200 mg every 4 weeks in patients with ulcerative colitis, mean steady-state trough serum guselkumab concentrations were approximately 1.4 mcg/mL and 10.7 mcg/mL, respectively.
Following subcutaneous maintenance dosing of guselkumab 100 mg every 8 weeks or guselkumab 200 mg every 4 weeks in patients with Crohn's disease, mean steady-state trough serum guselkumab concentrations were approximately 1.2 mcg/mL and 10.1 mcg/mL, respectively.
Distribution
Mean volume of distribution during the terminal phase (Vz) following a single intravenous administration to healthy subjects ranged from approximately 7 to 10 L across studies.
Biotransformation
The exact pathway through which guselkumab is metabolised has not been characterised. As a human IgG mAb, guselkumab is expected to be degraded into small peptides and amino acids via catabolic pathways in the same manner as endogenous IgG.
Elimination
Mean systemic clearance (CL) following a single intravenous administration to healthy subjects ranged from 0.288 to 0.479 L/day across studies. Mean half-life (T1/2) of guselkumab was approximately 17 days in healthy subjects and approximately 15 to 18 days in patients with plaque psoriasis across studies, and approximately 17 days in patients with ulcerative colitis or Crohn's disease.
Population pharmacokinetic analyses indicated that concomitant use of NSAIDs, AZA, 6-MP, oral corticosteroids and csDMARDs such as MTX, did not affect the clearance of guselkumab.
Linearity/non-linearity
The systemic exposure of guselkumab (Cmax and AUC) increased in an approximately dose-proportional manner following a single subcutaneous injection at doses ranging from 10 mg to 300 mg in healthy subjects or patients with plaque psoriasis. Serum guselkumab concentrations were approximately dose proportional following intravenous administration in patients with ulcerative colitis or Crohn's disease.
Paediatric patients
Steady-state serum trough concentrations of guselkumab were achieved by Week 20 in paediatric patients 6 to 17 years of age with moderate to severe plaque psoriasis treated with guselkumab subcutaneous injection using the 45 mg/0.45 mL pre-filled pen or the 100 mg pre-filled syringe (see section 4.2), and were within the range of those observed in adults.
The recommended dosing regimen results in similar predicted serum guselkumab exposure in paediatric patients with plaque psoriasis as compared to adults across the body weight range.
Elderly patients
No specific studies have been conducted in elderly patients. Of the 1 384 plaque psoriasis patients exposed to guselkumab in Phase III clinical studies and included in the population pharmacokinetic analysis, 70 patients were 65 years of age or older, including 4 patients who were 75 years of age or older. Of the 746 psoriatic arthritis patients exposed to guselkumab in Phase III clinical studies, a total of 38 patients were 65 years of age or older, and no patients were 75 years of age or older. Of the 859 ulcerative colitis patients exposed to guselkumab in Phase II/III clinical studies and included in the population pharmacokinetic analysis, a total of 52 patients were 65 years of age or older, and 9 patients were 75 years of age or older. Of the 1 009 Crohn's disease patients exposed to guselkumab in Phase III clinical studies and included in the population pharmacokinetic analysis, a total of 39 patients were 65 years of age or older, and 5 patients were 75 years of age or older.
Population pharmacokinetic analyses in plaque psoriasis, psoriatic arthritis, ulcerative colitis, and Crohn's disease patients indicated no apparent changes in CL/F estimate in patients ≥65 years of age compared to patients <65 years of age, suggesting no dose adjustment is needed for elderly patients.
Patients with renal or hepatic impairment
No specific study has been conducted to determine the effect of renal or hepatic impairment on the pharmacokinetics of guselkumab. Renal elimination of intact guselkumab, an IgG mAb, is expected to be low and of minor importance; similarly, hepatic impairment is not expected to influence clearance of guselkumab as IgG mAbs are mainly eliminated via intracellular catabolism. Based on population pharmacokinetic analyses, creatinine clearance or hepatic function did not have a meaningful impact on guselkumab clearance.
Body weight
Clearance and volume of distribution of guselkumab increases as body weight increases, however, observed clinical trial data indicate that dose adjustment for body weight is not warranted.
Preclinical safety data
Non-clinical data reveal no special hazard for humans based on conventional studies of safety pharmacology, repeat-dose toxicity, toxicity to reproduction and pre- and post-natal development.
In repeat-dose toxicity studies in cynomolgus monkeys, guselkumab was well tolerated via intravenous and subcutaneous routes of administration. A weekly subcutaneous dose of 50 mg/kg to monkeys resulted in exposure (AUC) values that were at least 23 times the maximum clinical exposures following a dose of 200 mg given intravenously. Additionally, there were no adverse immunotoxicity or cardiovascular safety pharmacology effects noted during the conduct of the repeat-dose toxicity studies or in a targeted cardiovascular safety pharmacology study in cynomolgus 38 monkeys.
There were no preneoplastic changes observed in histopathology evaluations of animals treated up to 24 weeks, or following the 12-week recovery period during which active substance was detectable in the serum.
No mutagenicity or carcinogenicity studies were conducted with guselkumab.
Guselkumab could not be detected in breast milk from cynomolgus monkeys as measured at post-natal day 28.
© All content on this website, including data entry, data processing, decision support tools, "RxReasoner" logo and graphics, is the intellectual property of RxReasoner and is protected by copyright laws. Unauthorized reproduction or distribution of any part of this content without explicit written permission from RxReasoner is strictly prohibited. Any third-party content used on this site is acknowledged and utilized under fair use principles.