EYLEA 114.3 mg/ml Solution for injection Ref.[110823] Active ingredients: Aflibercept
Source: European Medicines Agency (EU) Revision Year: 2025 Publisher: Bayer AG, 51368 Leverkusen, Germany
5.1. Pharmacodynamic properties
Pharmacotherapeutic group: Ophthalmologicals/Antineovascularisation agents
ATC code: S01LA05
Aflibercept is a recombinant fusion protein consisting of portions of human VEGF receptor 1 and 2 extracellular domains fused to the Fc portion of human IgG1.
Aflibercept is produced in Chinese hamster ovary (CHO) K1 cells by recombinant DNA technology.
Mechanism of action
Vascular endothelial growth factor-A (VEGF-A) and placental growth factor (PlGF) are members of the VEGF family of angiogenic factors that can act as potent mitogenic, chemotactic, and vascular permeability factors for endothelial cells. VEGF acts via two receptor tyrosine kinases, VEGFR-1 and VEGFR-2, present on the surface of endothelial cells. PlGF binds only to VEGFR-1, which is also present on the surface of leucocytes. Excessive activation of these receptors by VEGF-A can result in pathological neovascularisation and excessive vascular permeability. PlGF can act independently to activate the VEGFR-1 to promote an inflammatory response within the retina, and is known to increase in pathological states such as nAMD, diabetic retinopathy (DR), DME, and retinal vein occlusion (RVO).
Pharmacodynamic effects
Aflibercept acts as a soluble decoy receptor that binds VEGF-A and PlGF with higher affinity than their natural receptors, and thereby can inhibit the binding and activation of these cognate VEGF receptors.
In animal studies, aflibercept can prevent pathological neovascularization and vascular leakage in a number of different models of ocular disease.
nAMD
nAMD is characterised by pathological choroidal neovascularisation (CNV). Leakage of blood and fluid from CNV may cause retinal oedema and/or sub-/intra-retinal haemorrhage, resulting in loss of visual acuity.
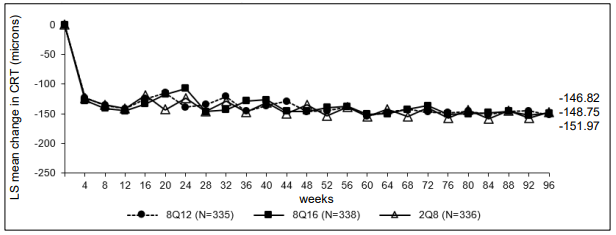
The pharmacodynamic effects of aflibercept 114.3 mg/ml administered every 12 (8Q12) and every 16 (8Q16) weeks are described in comparison with aflibercept 40 mg/ml administered every 8 weeks (2Q8) for the nAMD indication. These effects are shown as the change in CNV size from baseline to week 12; change in total lesion area from baseline to weeks 48, 60, and 96; and change from baseline in central retinal thickness (CRT).
In the pooled group of patients treated with 8Q12 or 8Q16, reductions in CNV size (LS mean, based on a mixed model for repeated measurements [MMRM]) at week 12 were -1.63 mm² compared to -1.17 mm² for patients treated with 2Q8.
Pharmacodynamic effects were generally maintained through week 156.
Table 2. Pharmacodynamic parameter (full analysis set) in the PULSAR study:
| Efficacy outcomes | Week | Eylea 8Q12 (N=335) | Eylea 8Q16 (N=338) | Eylea 2Q8 (N=336) |
|---|---|---|---|---|
| Change in total lesion area from baseline [mm2] | ||||
| LS meanA | 12 | -0.55 | -0.30 | |
| Arithmetic mean (SD), observed | 48 | -0.4 (2.9) | -0.2 (3.1) | 0.1 (3.6) |
| LS mean (SE)A | -0.46 (0.19) | -0.35 (0.20) | 0.09 (0.22) | |
| Difference in LS means (95% CI)A,B | -0.55 (-1.04, -0.06) | -0.44 (-0.94, -0.06) | ||
| Arithmetic mean (SD), observed | 60 | -0.5 (2.8) | -0.4 (3.2) | -0.3 (3.2) |
| LS mean (SE)A | -0.48 (0.20) | -0.54 (0.21) | -0.24 (0.20) | |
| Difference in LS means (95% CI)A,B | -0.24 (-0.72, 0.24) | -0.29 (-0.79, 0.20) | ||
| Arithmetic mean (SD), observed | 96 | -0.3 (3.3) | -0.3 (3.2) | -0.2 (3.4) |
| LS mean (SE)A | -0.43 (0.20) | -0.42 (0.20) | -0.18 (0.20) | |
| Difference in LS means (95% CI)A,B | -0.25 (-0.72, 0.21) | -0.24 (-0.71, 0.22) | ||
A LS mean, CI and p-value based on an MMRM with baseline best corrected visual acuity (BCVA) measurement as covariate, treatment group as factor, visit and stratification variables used for randomisation (geographical region, categorical baseline BCVA) as fixed factors as well as terms for the interaction between baseline BCVA and visit and for the interaction between treatment and visit.
B Absolute difference is Eylea 8Q12- or 8Q16-groups minus 2Q8-groups, respectively.
CI: Confidence interval
LS: Least square
SD: Standard deviation
SE: Standard error
Figure 1. LS mean change in central retinal thickness (CRT) from baseline through week 96 (full analysis set) in the PULSAR study:
DME
Diabetic macular oedema is characterised by increased vasopermeability and damage to the retinal capillaries which may result in loss of visual acuity.
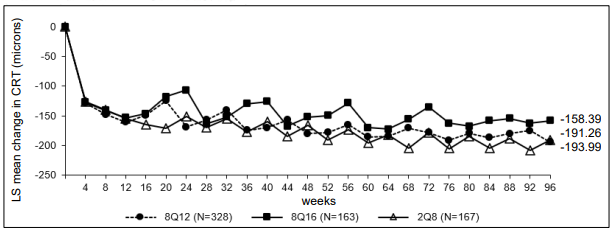
The pharmacodynamic effects of aflibercept 114.3 mg/ml administered every 12 (8Q12) and every 16 (8Q16) weeks are described in comparison with aflibercept 40 mg/ml administered every 8 weeks (2Q8) for the DME indication. These effects are shown as the change in the leakage area from baseline to weeks 48, 60, and 96.
Table 3. Pharmacodynamic parameter (full analysis set) in the PHOTON study:
| Efficacy Outcomes | Week | Eylea 8Q12 (N=328) | Eylea 8Q16 (N=163) | Eylea 2Q8 (N=167) |
|---|---|---|---|---|
| Change in leakage areaA from baseline [mm2] | ||||
| Arithmetic mean (SD), observed | 48 | -13.9 (13.91) | -9.4 (11.50) | -9.2 (12.11) |
| 60 | -13.9 (13.54) | -12.0 (13.26) | -14.4 (12.89) | |
| 96 | -12.8 (10.98) | -9.4 (10.61) | -11.9 (11.26) | |
A based on fluorescein angiography measurement
SD: Standard deviation
Figure 2. LS mean change in central retinal thickness (CRT) from baseline through week 96 (full analysis set) in the PHOTON study:
Immunogenicity
After dosing with Eylea 114.3 mg/ml for up to 96 weeks treatment-emergent antibodies to Eylea 114.3 mg/ml were detected in 2.5% to 4.4% of patients treated for DME and nAMD. No evidence of anti-drug antibodies impact on pharmacokinetics, efficacy or safety was observed.
Clinical efficacy and safety
nAMD
Study objectives
The safety and efficacy of Eylea 114.3 mg/ml were assessed in a randomised, multi-centre, double-masked, active-controlled study (PULSAR) in patients with treatment naïve nAMD.
The primary objective was to determine if treatment with Eylea 114.3 mg/ml at intervals of 12 (8Q12) or 16 weeks (8Q16) provides non-inferior best corrected visual acuity (BCVA) change compared to Eylea 40 mg/ml every 8 weeks in patients with nAMD.
The secondary objectives were to determine the effect of Eylea 114.3 mg/ml versus Eylea 40 mg/ml on anatomic and other visual measures of response, and to evaluate the safety, immunogenicity, and pharmacokinetics of aflibercept.
The primary efficacy endpoint was the change from baseline in BCVA measured by the early treatment diabetic retinopathy study (ETDRS) letter score at week 48.
The key secondary endpoints were the change in BCVA from baseline at week 60 and the proportion of patients with no intraretinal fluid (IRF) and no subretinal fluid (SRF) in central subfield at week 16. Further secondary endpoints were the proportion of patients gaining at least 15 letters in BCVA from baseline at week 48, the proportion of patients achieving an ETDRS letter score of at least 69 (approximate 20/40 Snellen equivalent) at week 48, and the change from baseline in National Eye Institute Visual Functioning Questionnaire-25 (NEI-VFQ-25) total score at week 48, among others.
In the PULSAR study a total of 1 009 patients were treated. The patients were assigned in a 1:1:1 ratio to 1 of 3 parallel treatment groups:
1. Eylea 114.3 mg/ml administered every 12 weeks (8Q12)
2. Eylea 114.3 mg/ml administered every 16 weeks (8Q16)
3. Eylea 40 mg/ml administered every 8 weeks (2Q8)
All patients received 3 initial injections of the assigned dose at 4-week intervals.
Per study protocol the interval of the 8Q12- and 8Q16-groups was to be shortened if both of the following criteria were met:
1. >5 letters loss in BCVA from week 12, and
2. >25 microns increase in CRT from week 12 or new foveal haemorrhage or new foveal neovascularisation.
Regardless of whether patient intervals were maintained or shortened in year 1, per study protocol all patients in the 8Q12- and 8Q16-groups were eligible for interval extension (by 4 weeks increments), beginning at week 52, if the following criteria were met:
1. <5 letters loss in BCVA from week 12, and
2. no fluid in the central subfield on optical coherence tomography (OCT), and
3. no new onset of foveal haemorrhage or foveal neovascularisation.
For patients who did not meet the criteria for shortening or extension of the interval, the dosing interval was maintained. The minimum interval between injections was 8 weeks in all groups. Patients with bilateral disease were eligible to receive Eylea 40 mg/ml treatment or another anti-VEGF medicinal product in their fellow eye.
Patient characteristics at baseline
Patient ages ranged from 50 to 96 years with a mean of 74.5 years. Approximately 92% (309/335) and 87% (295/338) of the patients randomised to the 8Q12- and 8Q16-groups, respectively, were 65 years of age or older and approximately 51% (172/335) and 51% (171/338) were 75 years of age or older.
Results
Patients in the 8Q12-, 8Q16- and 2Q8-groups who completed week 48 received a median (mean) of 6.0 (6.1), 5.0 (5.2) and 7.0 (6.9) injections, respectively.
At week 48, in the 8Q12-group, 79.4% of patients maintained Q12 intervals while in the 8Q16-group 76.6% of patients maintained Q16 intervals.
Patients in the 8Q12-, 8Q16- and 2Q8-groups who completed week 60 received a median (mean) of 7.0 (7.1), 6.0 (6.2) and 9.0 (8.8) injections, respectively.
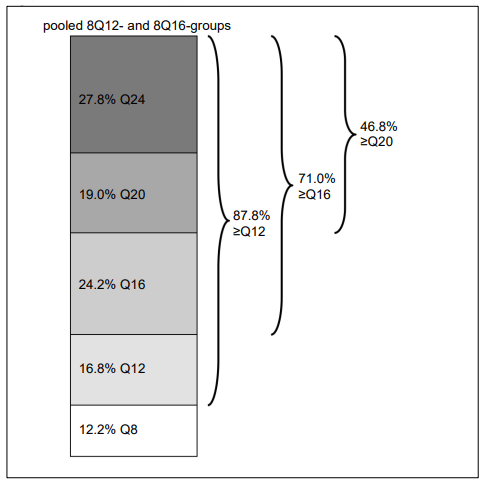
At week 60, 43.1% of patients in the 8Q12-group were extended to a treatment interval of 16 weeks, and 38.5% of patients in the 8Q16-group were extended to a treatment interval of 20 weeks. Patients in the 8Q12-, 8Q16- and 2Q8-groups who completed week 96 received a median (mean) of 9.0 (9.7), 8.0 (8.2) and 13.0 (12.8) injections, respectively. At week 96, in the pooled 8Q12- and 8Q16-groups 71.0% of patients had attained treatment intervals of ≥16 weeks, 46.8% of patients had attained treatment intervals of ≥20 weeks, and 27.8% of patients had attained treatment intervals of 24 weeks, while maintaining visual and anatomic outcomes.
Treatment with 8Q12 and 8Q16 was shown to be non-inferior and clinically equivalent to treatment with 2Q8 in terms of the primary efficacy endpoint 'mean change in BCVA at week 48' and the key secondary efficacy endpoint 'mean change in BCVA at week 60'. The treatment effect with Eylea 114.3 mg/ml in mean change in BCVA was maintained through week 96.
Furthermore, treatment with Eylea (pooled 8Q12- and 8Q16-groups) was shown to be superior to treatment with 2Q8 in terms of the key secondary efficacy endpoint 'proportion of patients with no intraretinal fluid (IRF) and no subretinal fluid (SRF) in the central subfield at week 16' (see table 4).
Table 4. Efficacy outcomes from the PULSAR study:
| Efficacy outcomes | Week | Eylea 8Q12 (N=335) | Eylea 8Q16 (N=338) | Eylea 2Q8 (N=336) |
|---|---|---|---|---|
| Change in BCVA from baseline as measured by ETDRS letter scoreD | ||||
| Arithmetic mean (SD), observed | 48 | 6.7 (12.6) | 6.2 (11.7) | 7.6 (12.2) |
| LS mean (SE)A | 6.06 (0.77) | 5.89 (0.72) | 7.03 (0.74) | |
| Difference in LS means (95% CI)A,B | -0.97 (-2.87, 0.92) | -1.14 (-2.97, 0.69) | ||
| p-value (one-sided non-inferiority test at a margin of 4 letters)A,B | 0.0009 | 0.0011 | ||
| Arithmetic mean (SD), observed | 60 | 6.6 (13.6) | 6.6 (11.7) | 7.8 (12.6) |
| LS mean (SE)A | 6.37 (0.74) | 6.31 (0.66) | 7.23 (0.68) | |
| Difference in LS means (95% CI)A,B | -0.86 (-2.57, 0.84) | -0.92 (-2.51, 0.66) | ||
| p-value (one-sided non-inferiority test at a margin of 4 letters)A,B | 0.0002 | <0.0001 | ||
| Arithmetic mean (SD), observed | 96 | 5.9 (14.2) | 5.6 (13.7) | 7.4 (13.8) |
| LS mean (SE)A | 5.59 (0.77) | 5.52 (0.75) | 6.60 (0.73) | |
| Difference in LS means (95% CI)A,B | -1.01 (-2.82, 0.80) | -1.08 (-2.87, 0.71) | ||
| Patients with no IRF and no SRF in the central subfieldD | ||||
| Proportion (LOCF) | 16 | 63.3% | 51.6% | |
| Adjusted difference in proportion (95% CI)B,C | 11.7% (5.3%, 18.2%) | |||
| p-value (one-sided superiority test)B,C | 0.0002 | |||
| Proportion (LOCF) | 48 | 71.1% | 66.8% | 59.4% |
| Adjusted difference in proportion (95% CI)B,C | 11.7% (4.5%, 18.9%) | 7.5% (0.1%, 14.8%) | ||
| Proportion (LOCF) | 60 | 74.6% | 72.2% | 74.6% |
| Adjusted difference in proportion (95% CI)B,C | 0.0% (-6.6%, 6.7%) | -2.2% (-8.9%, 4.4%) | ||
| Proportion (LOCF) | 96 | 69.6% | 63.6% | 66.5% |
| Adjusted difference in proportion (95% CI)B,C | 3.0% (-4.1%, 10.1%) | -3.0% (-10.2%, 4.2%) | ||
| Patients achieving an ETDRS letter score of at least 69 (approximate 20/40 Snellen equivalent)D | ||||
| Proportion (LOCF) | 48 | 56.9% | 54.3% | 57.9% |
| Adjusted difference in proportion (95% CI)B,C | -0.2% (-6.6%, 6.2%) | -2.2% (-8.4%, 4.0%) | ||
| Proportion (LOCF) | 60 | 56.3% | 54.6% | 58.2% |
| Adjusted difference in proportion (95% CI)B,C | -1.1% (-7.5%, 5.3%) | -2.3% (-8.7%, 4.1%) | ||
| Proportion (LOCF) | 96 | 53.3% | 53.1% | 56.7% |
| Adjusted difference in proportion (95% CI)B,C | -2.7% (-9.4%, 4.0%) | -2.4% (-9.1%, 4.2%) | ||
| Patients who gained at least 15 letters in BCVA from baselineD | ||||
| Proportion (LOCF) | 48 | 20.7% | 21.7% | 22.1% |
| Adjusted difference in proportion (95% CI)B,C | -1.7% (-7.8%, 4.3%) | -0.9% (-7.0%, 5.1%) | ||
| Proportion (LOCF) | 60 | 23.7% | 23.1% | 23.3% |
| Adjusted difference in proportion (95% CI)B,C | 0.1% (-6.2%, 6.3%) | -0.7% (-6.9%, 5.5%) | ||
| Proportion (LOCF) | 96 | 22.2% | 22.8% | 24.2% |
| Adjusted difference in proportion (95% CI)B,C | -2.4% (-8.4%, 3.6%) | -2.0% (-8.0%, 4.1%) | ||
| Last intended treatment intervals | ||||
| Patients at ≥Q12 treatment intervalE | ||||
| Proportion (pooled 8Q12- and 8Q16-groups) | 96 | 87.8% | n/a | |
| Proportion | 86.6% | 89.0% | n/a | |
| Patients at ≥Q16 treatment intervalE | ||||
| Proportion (pooled 8Q12- and 8Q16-groups) | 96 | 71.0% | n/a | |
| Proportion | 63.6% | 78.4% | n/a | |
| Patients at ≥Q20 treatment intervalE | ||||
| Proportion (pooled 8Q12- and 8Q16-groups) | 96 | 46.8% | n/a | |
| Proportion | 40.5% | 53.1% | n/a | |
| Patients at Q24 treatment intervalE | ||||
| Proportion (pooled 8Q12- and 8Q16-groups) | 96 | 27.8% | n/a | |
| Proportion | 24.7% | 30.8% | n/a | |
A LS mean, CI and p-value based on an MMRM with baseline best corrected visual acuity (BCVA) measurement as covariate, treatment group as factor, visit and stratification variables used for randomisation (geographical region, categorical baseline BCVA) as fixed factors as well as terms for the interaction between baseline BCVA and visit and for the interaction between treatment and visit.
B Absolute difference is Eylea 8Q12- or 8Q16-groups minus 2Q8-groups, respectively.
C Mantel-Haenszel weighted treatment difference with stratification variables used for randomization (geographical region, categorical baseline BCVA) and CI calculated using normal approximation.
D Full analysis set
E Safety analysis set; patients considered as completer for the respective timepoint
CI: Confidence interval
LOCF: Last observation carried forward
LS: Least square
SD: Standard deviation
SE: Standard error
Treatment intervals were analysed in a pre-specified exploratory manner.
Figure 3. LS mean change in BCVA as measured by ETDRS letter score from baseline through week 96 (full analysis set) in the PULSAR study:
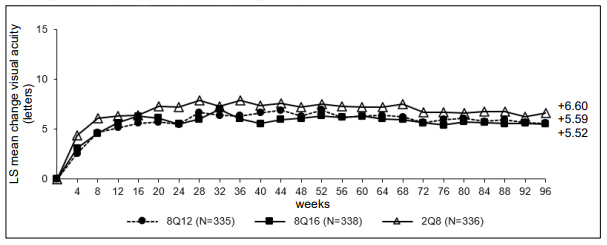
Figure 4. Last intended treatment interval at week 96:
No clinically meaningful differences were found between the 8Q12-, 8Q16- and 2Q8-groups in changes of NEI VFQ-25 total score at week 48 and week 96 from baseline.
Efficacy results in evaluable subgroups for age, gender, geographic region, ethnicity, race, baseline BCVA, and lesion type were consistent with the results in the overall population.
Efficacy was generally maintained through week 96.
Results - PULSAR extension phase
At the end of the main phase of the study at week 96, patients could enrol into the 60 week, open-label extension phase. 417 patients originally assigned to 8Q12 and 8Q16 continued on Eylea 114.3 mg/ml while maintaining their latest intervals. 208 patients originally assigned to 2Q8 at the beginning of the study were switched to Eylea 114.3 mg/ml starting at 12-week intervals. Treatment intervals could be further adjusted based on the physician's judgement of visual and/or anatomic outcomes.
In those patients originally assigned to 8Q12 and 8Q16, the treatment effect with Eylea 114.3 mg/ml was generally maintained throughout 3 years (week 156). The LS mean change from baseline in the pooled 8Q12- and 8Q16-groups in BCVA was +3.41 letters and in CRT was -148.05 microns at week 156.
In those patients originally assigned to 2Q8, the treatment effect with Eylea 114.3 mg/ml was similar. The LS mean change from baseline in BCVA was +4.58 letters and in CRT was -145.21 microns at week 156.
Patients in the 8Q12- and 8Q16-groups who completed week 156 received a median (mean) of 13.0 (13.5) and 11.0 (12.2) injections, respectively.
Patients who switched to Eylea 114.3 mg/ml and completed week 156 received a total median (mean) of 18.0 (17.7) injections, of which 5.0 (4.9) injections were administered after the switch to Eylea 114.3 mg/ml within the 60 weeks of the study extension phase.
The overall safety profile in the extension phase was similar to that observed in the main phase.
Table 5. Efficacy outcomes from the PULSAR extension phase at week 156:
| Efficacy outcomes | 8Q12 continued on Eylea 114.3 mg/ml (N=185) | 8Q16 continued on Eylea 114.3 mg/ml (N=190) | 2Q8 switched to Eylea 114.3 mg/ml (N=208) |
|---|---|---|---|
| Change in BCVA from baseline (LS mean) | +3.57 letters | +3.23 letters | +4.58 letters |
| Change in CRT from baseline (LS mean) | -148.42 microns | -147.54 microns | -145.21 microns |
| Last intended treatment intervalA | |||
| ≥12 weeks | 76.2% | 78.4% | 78.5% |
| ≥16 weeks | 53.5% | 62.1% | 42.5% |
| ≥20 weeks | 37.8% | 42.6% | 16.1% |
| 24 weeks | 23.8% | 24.2% | NAB |
A based on patients completing week 156
B NA for patients originally randomised to 2Q8, due to study design/length of study
DME
Study objectives
The safety and efficacy of Eylea 114.3 mg/ml were assessed in a randomised, multi-centre, double-masked, active-controlled study (PHOTON) in patients with DME.
The primary objective was to determine if treatment with Eylea 114.3 mg/ml at intervals of 12 (8Q12) or 16 weeks (8Q16) provides non-inferior BCVA change compared to Eylea 40 mg/ml every 8 weeks. The secondary objectives were to determine the effect of Eylea 114.3 mg/ml versus Eylea 40 mg/ml on anatomic and other visual measures of response, and to evaluate the safety, immunogenicity, and pharmacokinetics of aflibercept.
The primary efficacy endpoint was the change from baseline in BCVA measured by the early treatment diabetic retinopathy study (ETDRS) letter score at week 48.
One key secondary endpoint was the change in BCVA from baseline at week 60. Further secondary endpoints were the proportion of patients gaining at least 15 letters in BCVA from baseline at week 48, the proportion of patients achieving an ETDRS letter score of at least 69 (approximate 20/40 Snellen equivalent) at week 48, and the change from baseline in National Eye Institute Visual Functioning Questionnaire-25 (NEI-VFQ-25) total score at week 48, among others.
In the PHOTON study a total of 658 patients were treated. The patients were assigned in a 2:1:1 ratio to 1 of 3 parallel treatment groups:
1. Eylea 114.3 mg/ml administered every 12 weeks (8Q12)
2. Eylea 114.3 mg/ml administered every 16 weeks (8Q16)
3. Eylea 40 mg/ml administered every 8 weeks (2Q8)
Patients who were switched from other anti-VEGF medicinal products to Eylea 114.3 mg/ml received the last injection of the previous treatment at least 12 weeks prior to initiating the Eylea 114.3 mg/ml treatment.
All patients in the 8Q12- and 8Q16-groups received 3 initial injections and all patients in the 2Q8-group received 5 initial injections at 4-week intervals.
Per study protocol the interval of the 8Q12- and 8Q16-groups was to be shortened if both of the following criteria were met:
1. >10 letter loss in BCVA from week 12 in association with persistent or worsening DME, and
2. >50 microns increase in CRT from week 12.
Regardless of whether patient intervals were maintained or shortened in year 1, per study protocol all patients in the 8Q12- and 8Q16-groups were eligible for interval extension (by 4 weeks increments), beginning at week 52, if the following criteria were met:
1. <5 letter loss in BCVA from week 12, and
2. CRT <300 microns on SD-OCT (or <320 microns if measured including RPE).
For patients who did not meet the criteria for shortening or extension of the interval, the dosing interval was maintained. The minimum interval between injections was 8 weeks in all groups. Patients with bilateral disease were eligible to receive Eylea 40 mg/ml treatment in their fellow eye.
Patient characteristics at baseline
Patient ages ranged from 24 to 90 years with a mean of 62.3 years.
Approximately 44% (143/328) and 44% (71/163) of the patients randomised to the 8Q12- and 8Q16-groups, respectively, were 65 years of age or older and approximately 11% (36/328) and 14% (14/163) were 75 years of age or older.
The proportion of patients who were treated previously for DME was balanced between the treatment groups (43.6% in 8Q12-, 43.6% in 8Q16-, 44.3% in 2Q8-group).
Results
Patients in the 8Q12-, 8Q16- and 2Q8-groups who completed week 48 received a median (mean) of 6.0 (6.0), 5.0 (5.0) and 8.0 (7.9) injections, respectively.
At week 48, in the 8Q12-group, 91.0% of patients maintained Q12 intervals while in the 8Q16-group 89.1% of patients maintained Q16 intervals.
Patients in the 8Q12-, 8Q16- and 2Q8-groups who completed week 60 received a median (mean) of 7.0 (7.0), 6.0 (6.0) and 10.0 (9.8) injections, respectively. At week 60, 42.6% of patients in the 8Q12-group were extended to a treatment interval of 16 weeks, and 34.2% of patients in the 8Q16-group were extended to a treatment interval of 20 weeks.
Patients in the 8Q12-, 8Q16- and 2Q8-groups who completed week 96 received a median (mean) of 9.0 (9.5), 8.0 (7.8) and 14.0 (13.8) injections, respectively.
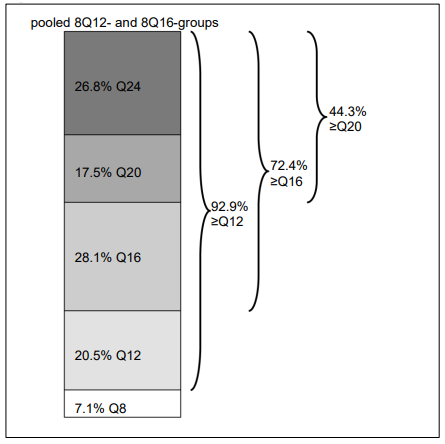
At week 96, in the pooled 8Q12- and 8Q16-groups 72.4% of patients had attained treatment intervals of ≥16 weeks, 44.3% of patients had attained treatment intervals of ≥20 weeks, and 26.8% of patients had attained treatment intervals of 24 weeks, while maintaining visual and anatomic outcomes.
Treatment with Eylea (both 8Q12- and 8Q16-groups) was shown to be non-inferior and clinically equivalent to treatment with 2Q8 in terms of the primary efficacy endpoint 'mean change in BCVA at week 48' and the key secondary efficacy endpoint 'mean change in BCVA at week 60'. The treatment effect with Eylea 114.3 mg/ml in mean change in BCVA was maintained through week 96.
Table 5. Efficacy outcomes from the PHOTON study:
| Efficacy outcomes | Week | Eylea 8Q12 (N=328) | Eylea 8Q16 (N=163) | Eylea 2Q8 (N=167) |
|---|---|---|---|---|
| Change in BCVA from baseline as measured by ETDRS letter scoreD | ||||
| Arithmetic mean (SD), observed | 48 | 8.77 (8.95) | 7.86 (8.38) | 9.21 (8.99) |
| LS mean (SE)A | 8.10 (0.61) | 7.23 (0.71) | 8.67 (0.73) | |
| Difference in LS means (95% CI)A,B | -0.57 (-2.26, 1.13) | -1.44 (-3.27, 0.39) | ||
| p-value (one-sided non-inferiority test at a margin of 4 letters)A,B | <0.0001 | 0.0031 | ||
| Arithmetic mean (SD), observed | 60 | 9.05 (9.27) | 7.96 (9.14) | 9.62 (9.58) |
| LS mean (SE)A | 8.52 (0.63) | 7.64 (0.75) | 9.40 (0.77) | |
| Difference in LS means (95% CI)A,B | -0.88 (-2.67, 0.91) | -1.76 (-3.71, 0.19) | ||
| p-value (one-sided non-inferiority test at a margin of 4 letters)A,B | 0.0003 | 0.0122 | ||
| Arithmetic mean (SD), observed | 96 | 8.82 (9.93) | 7.50 (9.86) | 8.41 (11.10) |
| LS mean (SE)A | 8.15 (0.63) | 6.59 (0.77) | 7.70 (0.89) | |
| Difference in LS means (95% CI)A,B | -0.45 (-1.55, 2.45) | -1.11 (-3.27, 1.05) | ||
| Patients achieving an ETDRS letter score of at least 69 (approximate 20/40 Snellen equivalent)D | ||||
| Proportion (LOCF) | 48 | 65.3% | 62.6% | 63.0% |
| Adjusted difference in proportion (95% CI)B,C | 2.45% (-6.47%, 11.36%) | -0.67% (-11.16%, 9.82%) | ||
| Proportion (LOCF) | 60 | 64.7% | 62.0% | 60.6% |
| Adjusted difference in proportion (95% CI)B,C | 4.34% (-4.72%, 13.40%) | 1.63% (-8.91%, 12.17%) | ||
| Proportion (LOCF) | 96 | 66.9% | 61.3% | 63.0% |
| Adjusted difference in proportion (95% CI)B,C | 4.01% (-4.99%, 13.01%) | -1.51% (-11.91%, 8.89%) | ||
| Patients who gained at least 15 letters in BCVA from baselineD | ||||
| Proportion (LOCF) | 48 | 18.7% | 16.6% | 23.0% |
| Adjusted difference in proportion (95% CI)B,C | -4.64% (-12.30%, 3.02%) | -7.14% (-15.45%, 1.17%) | ||
| Proportion (LOCF) | 60 | 21.5% | 16.0% | 26.1% |
| Adjusted difference in proportion (95% CI)B,C | -5.01% (-13.04%, 3.02%) | -10.78% (-19.27%, -2.29%) | ||
| Proportion (LOCF) | 96 | 24.5% | 19.6% | 26.1% |
| Adjusted difference in proportion (95% CI)B,C | -1.88% (-10.03%, 6.28%) | -7.07% (-15.94%, 1.80%) | ||
| Last intended treatment intervals | ||||
| Patients at ≥Q12 treatment intervalE | ||||
| Proportion (pooled 8Q12- and 8Q16-groups) | 96 | 92.9% | n/a | |
| Proportion | 91.8% | 95.0% | n/a | |
| Patients at ≥Q16 treatment intervalE | ||||
| Proportion (pooled 8Q12- and 8Q16-groups) | 96 | 72.4% | n/a | |
| Proportion | 64.1% | 87.8% | n/a | |
| Patients at ≥Q20 treatment intervalE | ||||
| Proportion (pooled 8Q12- and 8Q16-groups) | 96 | 44.3% | n/a | |
| Proportion | 43.0% | 46.8% | n/a | |
| Patients at Q24 treatment intervalE | ||||
| Proportion (pooled 8Q12- and 8Q16-groups) | 96 | 26.8% | n/a | |
| Proportion | 23.8% | 32.4% | n/a | |
A LS mean, CI and p-value based on an MMRM with baseline best corrected visual acuity (BCVA) measurement as covariate, treatment group as factor, visit and stratification variables used for randomisation (geographical region, categorical baseline BCVA) as fixed factors as well as terms for the interaction between baseline BCVA and visit and for the interaction between treatment and visit.
B Absolute difference is Eylea 8Q12- or 8Q16-groups minus 2Q8-groups, respectively.
C Mantel-Haenszel weighted treatment difference with stratification variables used for randomization (geographical region, categorical baseline BCVA) and CI calculated using normal approximation.
D Full analysis set.
E Safety analysis set; patients considered as completer for the respective timepoint.
CI: Confidence interval
LOCF: Last observation carried forward
LS: Least square
SD: Standard deviation
SE: Standard error
Treatment intervals were analysed in a pre-specified exploratory manner.
Figure 5. LS mean change in BCVA as measured by ETDRS letter score from baseline through week 96 (full analysis set) in the PHOTON study:
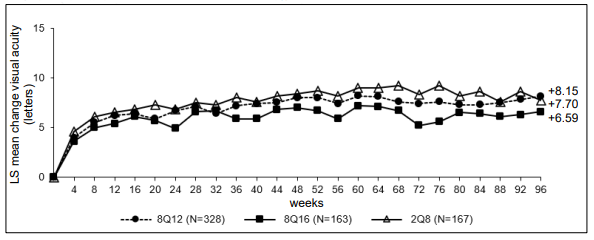
Figure 6. Last intended treatment interval at week 96:
Eylea at all doses (8Q12, 8Q16, 2Q8) demonstrated meaningful increase from baseline in the pre-specified secondary efficacy endpoint national eye institute visual function questionnaire (NEI VFQ-25).
No clinically meaningful differences were found between the 8Q12-, 8Q16- and 2Q8-groups in changes of NEI VFQ-25 total score at week 48 and week 96 from baseline.
Efficacy results in evaluable subgroups for age, gender, geographic region, ethnicity, race, baseline BCVA and baseline CRT and prior DME treatment were consistent with the results in the overall population.
Efficacy was generally maintained through week 96.
Treatment effects in the sub-group of previously treated patients were similar to those seen in patients who were treatment naïve.
Results - PHOTON extension phase
At the end of the main phase of the study at week 96, patients could enrol into the 60 week, open-label extension phase. 195 patients originally assigned to 8Q12 and 8Q16 continued on Eylea 114.3 mg/ml while maintaining their latest intervals. 70 patients originally assigned to 2Q8 at the beginning of the study were switched to Eylea 114.3 mg/ml starting at 12-week intervals. Treatment intervals could be further adjusted based on the physician's judgement of visual and/or anatomic outcomes.
In those patients originally assigned to 8Q12 and 8Q16, the treatment effect with Eylea 114.3 mg/ml was generally maintained throughout 3 years (week 156). The LS mean change from baseline in the pooled 8Q12- and 8Q16-groups in BCVA was +7.2 letters and in CRT was -192.4 microns at week 156.
In those patients originally assigned to 2Q8, the treatment effect with Eylea 114.3 mg/ml was similar. The LS mean change from baseline in BCVA was +6.5 letters and in CRT was -197.4 microns at week 156.
Patients in the 8Q12- and 8Q16-groups who completed week 156 received a median (mean) of 13.0 (13.2) and 11.0 (11.4) injections, respectively.
Patients who switched to Eylea 114.3 mg/ml and completed week 156 received a total median (mean) of 19.0 (18.6) injections, of which 5.0 (4.8) injections were administered after the switch to Eylea 114.3 mg/ml within the 60 weeks of the study extension phase.
The overall safety profile in the extension phase was similar to that observed in the main phase.
Table 7. Efficacy outcomes from the PHOTON extension phase at week 156:
| Efficacy outcomes | 8Q12 continued on Eylea 114.3 mg/ml (N=103) | 8Q16 continued on Eylea 114.3 mg/ml (N=49) | 2Q8 switched to Eylea 114.3 mg/ml (N=70) |
|---|---|---|---|
| Change in BCVA from baseline (LS mean) | +6.8 letters | +8.1 letters | +6.5 letters |
| Change in CRT from baseline (LS mean) | -190.3 microns | -198.1 microns | -197.4 microns |
| Last intended treatment intervalA | |||
| ≥12 weeks | 85.4% | 91.8% | 82.8% |
| ≥16 weeks | 62.1% | 81.6% | 50.0% |
| ≥20 weeks | 40.8% | 63.3% | 19.0% |
| 24 weeks | 20.4% | 42.9% | NAB |
A based on patients completing week 156
B NA for patients originally randomised to 2Q8, due to study design/length of study
Paediatric population
The European Medicines Agency has waived the obligation to submit the results of studies with aflibercept in all subsets of the paediatric population in nAMD and DME (see section 4.2 for information on paediatric use).
5.2. Pharmacokinetic properties
Absorption / Distribution
Aflibercept is slowly absorbed from the eye into the systemic circulation after intravitreal administration and is predominately observed in the systemic circulation as an inactive, stable complex with VEGF; however only "free aflibercept" is able to bind endogenous VEGF.
Following unilateral intravitreal administration of 8 mg aflibercept, the mean (SD) Cmax of free aflibercept in plasma was 0.25 (0.21) mg/l, and the median time to maximal concentration in plasma was 1 day, in the nAMD and DME population combined. The accumulation of free aflibercept in plasma following 3 initial monthly doses was minimal. Subsequently, no further accumulation was observed. These data are also supported by population pharmacokinetic analyses.
Elimination
Aflibercept is a protein-based therapeutic and no metabolism studies have been conducted.
Aflibercept is expected to undergo elimination through both target-mediated disposition via binding to free endogenous VEGF and metabolism via proteolysis. The median time to reach the last quantifiable concentration of free aflibercept in plasma for 8 mg administered intravitreally was 3 weeks.
Renal or hepatic impairment
No special studies in patients with renal or hepatic impairment have been conducted with Eylea 114.3 mg/ml.
The systemic exposures to aflibercept in patients with mild to severe renal impairment were similar to those with normal renal function. Limited available data in patients with mild hepatic impairment do not indicate an influence on systemic exposures to aflibercept compared to patients with normal hepatic function.
5.3. Preclinical safety data
Erosions and ulcerations of the respiratory epithelium in nasal turbinates in monkeys treated with aflibercept intravitreally were observed at systemic exposures in excess of the maximum human exposure. The systemic exposure for free aflibercept was approximately 26- and 33-fold higher based on Cmax and AUC when compared to corresponding values in adult patients after an intravitreal dose of 8 mg. At the No Observed Adverse Effect Level (NOAEL) of 0.5 mg/eye in monkeys the systemic exposure was 3.2- and 3.8-fold higher based on Cmax and AUC when compared to corresponding values in adult patients.
No studies have been conducted on the mutagenic or carcinogenic potential of aflibercept.
An effect of aflibercept on intrauterine development was shown in embryo-foetal development studies in pregnant rabbits with intravenous (3 to 60 mg/kg) as well as subcutaneous (0.1 to 1 mg/kg) administration. The maternal NOAEL was at the dose of 3 mg/kg or 1 mg/kg, respectively. A developmental NOAEL was not identified. At the 0.1 mg/kg dose, the systemic exposure for free aflibercept was approximately 1.0- and 1.0-fold based on Cmax and cumulative AUC when compared to corresponding values in adult patients after an intravitreal dose of 8 mg.
Effects on male and female fertility were assessed as part of a 6-month study in monkeys with intravenous administration of aflibercept at doses ranging from 3 to 30 mg/kg. Absent or irregular menses associated with alterations in female reproductive hormone levels and changes in sperm morphology and motility were observed at all dose levels. Based on Cmax and AUC for free aflibercept observed at the 3 mg/kg intravenous dose, the systemic exposures were approximately 377-fold and 104-fold higher, respectively, than the exposure in humans after an intravitreal dose of 8 mg. All changes were reversible.
© All content on this website, including data entry, data processing, decision support tools, "RxReasoner" logo and graphics, is the intellectual property of RxReasoner and is protected by copyright laws. Unauthorized reproduction or distribution of any part of this content without explicit written permission from RxReasoner is strictly prohibited. Any third-party content used on this site is acknowledged and utilized under fair use principles.