ZEPBOUND Solution for injection Ref.[109319] Active ingredients: Tirzepatide
Source: FDA, National Drug Code (US) Revision Year: 2023
12.1. Mechanism of Action
Tirzepatide is a GIP receptor and GLP-1 receptor agonist. It is an amino acid sequence including a C20 fatty diacid moiety that enables albumin binding and prolongs the half-life. Tirzepatide selectively binds to and activates both the GIP and GLP-1 receptors, the targets for native GIP and GLP-1.
GLP-1 is a physiological regulator of appetite and caloric intake. Nonclinical studies suggest the addition of GIP may further contribute to the regulation of food intake.
12.2. Pharmacodynamics
Tirzepatide lowers body weight with greater fat mass loss than lean mass loss. Tirzepatide decreases calorie intake, and the effects are likely mediated by affecting appetite.
Tirzepatide stimulates insulin secretion in a glucose-dependent manner and reduces glucagon secretion. Tirzepatide increases insulin sensitivity, as demonstrated in a hyperinsulinemic euglycemic clamp study in patients with type 2 diabetes mellitus after 28 weeks of treatment. These effects can lead to a reduction of blood glucose.
Tirzepatide delays gastric emptying. The delay is largest after the first dose and this effect diminishes over time.
12.3. Pharmacokinetics
The pharmacokinetics of tirzepatide is similar between healthy subjects and patients with overweight or obesity. Steady-state plasma tirzepatide concentrations were achieved following 4 weeks of once weekly administration. Tirzepatide exposure increases in a dose-proportional manner.
Excretion
The primary excretion routes of tirzepatide metabolites are via urine and feces. Intact tirzepatide is not observed in urine or feces.
Specific Populations
The intrinsic factors of age (18 to 84 years), sex, race (71% White, 11% Asian, 9% American Indian or Alaska Native, and 8% Black or African American), ethnicity, or body weight do not have a clinically relevant effect on the PK of tirzepatide.
Patients with Renal Impairment
Renal impairment does not impact the pharmacokinetics of tirzepatide. The pharmacokinetics of tirzepatide after a single 5 mg dose were evaluated in patients with different degrees of renal impairment (mild, moderate, severe, ESRD) compared with subjects with normal renal function. Data from clinical studies have also shown that renal impairment in patients with overweight or obesity does not impact the pharmacokinetics of tirzepatide [see Use in Specific Populations (8.6)].
Patients with Hepatic Impairment
Hepatic impairment does not impact the pharmacokinetics of tirzepatide. The pharmacokinetics of tirzepatide after a single 5 mg dose were evaluated in patients with different degrees of hepatic impairment (mild, moderate, severe) compared with subjects with normal hepatic function [see Use in Specific Populations (8.7)].
Drug Interaction Studies
Potential for Tirzepatide to Influence the Pharmacokinetics of Other Drugs
In vitro studies have shown low potential for tirzepatide to inhibit or induce CYP enzymes, and to inhibit drug transporters.
ZEPBOUND delays gastric emptying and thereby has the potential to impact the absorption of concomitantly administered oral medications [see Drug Interactions (7.2)].
The impact of tirzepatide on gastric emptying was greatest after a single dose of 5 mg and diminished after subsequent doses.
Following a first dose of tirzepatide 5 mg, acetaminophen maximum concentration (Cmax) was reduced by 55%, and the median peak plasma concentration (tmax) occurred 1 hour later. After coadministration at Week 6 with tirzepatide 15 mg, there was no meaningful impact on acetaminophen Cmax and tmax. Overall acetaminophen exposure (AUC0-24hr) was not influenced.
Following administration of a combined oral contraceptive (0.035 mg ethinyl estradiol and 0.25 mg norgestimate) in the presence of a single dose of tirzepatide 5 mg, mean Cmax of ethinyl estradiol, norgestimate, and norelgestromin was reduced by 59%, 66%, and 55%, while mean AUC was reduced by 20%, 21%, and 23%, respectively. A delay in tmax of 2.5 to 4.5 hours was observed.
Absorption
Following subcutaneous administration, the median time (range) to maximum plasma concentration of tirzepatide is 24 hours (8 to 72 hours). The mean absolute bioavailability of tirzepatide following subcutaneous administration is 80%. Similar exposure was achieved with subcutaneous administration of tirzepatide in the abdomen, thigh, or upper arm.
Distribution
The mean [coefficient of variation (CV)%] apparent steady-state volume of distribution of tirzepatide following subcutaneous administration in patients with overweight or obesity is approximately 9.7 L (28.5%). Tirzepatide is highly bound to plasma albumin (99%).
Elimination
The apparent population mean clearance (CV%) of tirzepatide in patients with overweight or obesity is 0.056 L/h (20.9%) with an elimination half-life of approximately 5 days.
Metabolism
Tirzepatide is metabolized by proteolytic cleavage of the peptide backbone, beta-oxidation of the C20 fatty diacid moiety, and amide hydrolysis.
13.1. Carcinogenesis, Mutagenesis, Impairment of Fertility
A 2-year carcinogenicity study was conducted with tirzepatide in male and female rats at doses of 0.15, 0.50, and 1.5 mg/kg (0.1-, 0.4-, and 1-fold the MRHD of 15 mg once weekly based on AUC) administered by subcutaneous injection twice weekly. A statistically significant increase in thyroid C-cell adenomas was observed in male rats (≥0.5 mg/kg) and female rats (≥0.15 mg/kg), and a statistically significant increase in thyroid C-cell adenomas and carcinomas combined was observed in male and female rats at all doses examined. In a 6-month carcinogenicity study in rasH2 transgenic mice, tirzepatide at doses of 1, 3, and 10 mg/kg administered by subcutaneous injection twice weekly was not tumorigenic.
Tirzepatide was not genotoxic in a rat bone marrow micronucleus assay.
In fertility and early embryonic development studies, male and female rats were administered twice weekly subcutaneous doses of 0.5, 1.5, or 3 mg/kg (0.3-, 1-, and 2-fold and 0.3-, 0.9-, and 2-fold, respectively, the MRHD of 15 mg once weekly based on AUC). No effects of tirzepatide were observed on sperm morphology, mating, fertility, and conception. In female rats, an increase in the number of females with prolonged diestrus and a decrease in the mean number of corpora lutea resulting in a decrease in the mean number of implantation sites and viable embryos was observed at all dose levels. These effects were considered secondary to the pharmacological effects of tirzepatide on food consumption and body weight.
14. Clinical Studies
14.1 Weight Management Studies in Adults with Overweight or Obesity
Overview of Clinical Studies
The efficacy of ZEPBOUND for chronic weight management (weight reduction and maintenance) in conjunction with a reduced-calorie diet and increased physical activity was studied in two randomized, double-blind, placebo-controlled trials (Study 1 and Study 2), in which weight reduction was assessed after 72 weeks of treatment (at least 52 weeks at maintenance dose). In Study 1, the dose of ZEPBOUND or matching placebo was escalated to 5 mg, 10 mg, or 15 mg subcutaneously once weekly during a 20-week titration period followed by the maintenance period. In Study 2, the dose of ZEPBOUND or matching placebo was escalated to 10 mg or 15 mg subcutaneously once weekly during a 20-week titration period followed by the maintenance period.
In Studies 1 and 2, all patients received instruction on a reduced-calorie diet (approximately 500 kcal/day deficit) and increased physical activity counseling (recommended to a minimum of 150 min/week) that began with the first dose of study medication or placebo and continued throughout the trial.
Study 1 (NCT04184622) was a 72-week trial that enrolled 2539 adult patients with obesity (BMI ≥30 kg/m2), or with overweight (BMI 27 to <30 kg/m 2) and at least one weight-related comorbid condition, such as dyslipidemia, hypertension, obstructive sleep apnea, or cardiovascular disease; patients with type 2 diabetes mellitus were excluded. Patients were randomized in a 1:1:1:1 ratio to ZEPBOUND 5 mg, ZEPBOUND 10 mg, ZEPBOUND 15 mg, or placebo once weekly. At baseline, mean age was 45 years (range 18-84 years), 68% were women, 71% were White, 11% were Asian, 9% were American Indian/Alaska Native, and 8% were Black or African American. A total of 48% were Hispanic or Latino. Mean baseline body weight was 104.8 kg and mean BMI was 38 kg/m 2. Baseline characteristics included 32% with hypertension, 30% with dyslipidemia, 8% with obstructive sleep apnea, and 3% with cardiovascular disease.
Study 2 (NCT04657003) was a 72-week trial that enrolled 938 adult patients with BMI ≥27 kg/m2 and type 2 diabetes mellitus. Patients included in the trial had HbA1c 7-10% and were treated with either diet and exercise alone, or any oral anti-hyperglycemic agent except dipeptidyl peptidase-4 (DPP-4) inhibitors or GLP-1 receptor agonists. Patients who were taking insulin or injectable GLP-1 receptor agonists for type 2 diabetes mellitus were excluded. Patients were randomized in a 1:1:1 ratio to ZEPBOUND 10 mg, ZEPBOUND 15 mg, or placebo once weekly. At baseline, mean age was 54 years (range 18-85 years), 51% were women, 76% were White, 13% were Asian, and 8% were Black or African American. A total of 60% were Hispanic or Latino. Mean baseline body weight was 100.7 kg and mean BMI was 36.1 kg/m2. Baseline characteristics included 66% with hypertension, 61% with dyslipidemia, 8% with obstructive sleep apnea, and 10% with cardiovascular disease.
Results
The proportions of patients who discontinued study drug in Study 1 were 14.3%, 16.4%, and 15.1% for the 5 mg, 10 mg, and 15 mg ZEPBOUND-treated groups, respectively, and 26.4% for the placebo-treated group. The proportions of patients who discontinued study drug in Study 2 were 9.3% and 13.8% for the 10 mg and 15 mg ZEPBOUND-treated groups, respectively, and 14.9% for the placebo-treated group.
For Studies 1 and 2, the primary efficacy parameters were mean percent change in body weight and the percentage of patients achieving ≥5% weight reduction from baseline to Week 72 (see Table 3).
After 72 weeks of treatment, ZEPBOUND resulted in a statistically significant reduction in body weight compared with placebo, and greater proportions of patients treated with ZEPBOUND 5 mg, 10 mg, and 15 mg achieved at least 5% weight reduction compared to placebo. Among patients treated with ZEPBOUND 10 mg and 15 mg, greater proportions of patients achieved at least 10%, 15%, and 20% weight reduction compared to placebo (see Table 3). A reduction in body weight was observed with ZEPBOUND irrespective of age, sex, race, ethnicity, baseline BMI, and glycemic status.
Table 3. Changes in Body Weight at Week 72 in Studies 1 and 2:
| Study 1 | Study 2 | ||||||
| Intention-to-Treat (ITT) Population a | Placebo N = 643 | ZEPBOUND 5 mg N = 630 | ZEPBOUND 10 mg N = 636 | ZEPBOUND 15 mg N = 630 | Placebo N = 315 | ZEPBOUND 10 mg N = 312 | ZEPBOUND 15 mg N = 311 |
| Body Weight | |||||||
| Baseline mean (kg) | 104.8 | 102.9 | 105.8 | 105.6 | 101.7 | 100.9 | 99.6 |
| % Change from baseline b | -3.1 | -15.0 | -19.5 | -20.9 | -3.2 | -12.8 | -14.7 |
| % Difference from placebo b (95% CI) | -11.9 (-13.4, _10.4) d | -16.4 ( _17.9, -14.8) d | -17.8 ( _19.3, -16.3) d | -9.6 (-11.1, -8.1) d | -11.6 (-13.0, -10.1) d | ||
| % of Patients losing ≥5% body weight | 34.5 | 85.1 | 88.9 | 90.9 | 32.5 | 79.2 | 82.8 |
| % Difference from placebo (95% CI) | 50.3 (44.3, 56.2) c,d | 54.6 (49.1, 60.0) c,d | 56.4 (50.9, 62.0) c,d | 46.8 (39.5, 54.1) c,d | 50.4 (43.1, 57.8) c,d | ||
| % of Patients losing ≥10% body weight | 18.8 | 68.5 | 78.1 | 83.5 | 9.5 | 60.5 | 64.8 |
| % Difference from placebo (95% CI) | 49.3 (43.6, 54.9) c,e | 59.5 (54.2, 64.9) c,d | 64.8 (59.6, 70.1) c,d | 51.0 (44.4, 57.7) c,d | 55.3 (48.6, 62.0) c,d | ||
| % of Patients losing ≥15% body weight | 8.8 | 48.0 | 66.6 | 70.6 | 2.7 | 39.7 | 48.0 |
| % Difference from placebo (95% CI) | 38.7 (33.6, 43.7) c,e | 58.1 (53.2, 63.0) c,d | 62.0 (57.2, 66.8) c,d | 37.0 (31.1, 42.9) c,d | 45.4 (39.4, 51.4) c,d | ||
| % of Patients losing ≥20% body weight | 3.1 | 30.0 | 50.1 | 56.7 | 1.0 | 21.5 | 30.8 |
| % Difference from placebo (95% CI) | 26.6 (22.4, 30.7) c,e | 47.3 (42.7, 51.9) c,d | 53.8 (49.3, 58.3) c,d | 20.5 (15.7, 25.4) c,d | 29.7 (24.3, 35.0) c,d | ||
Abbreviations: ANCOVA = analysis of covariance; CI = confidence interval; N = number of patients randomly assigned to study drug.
a The intention-to-treat population includes all randomly assigned patients. For Study 1 at Week 72, body weight was missing for 21.6%, 10.2%, 10.5%, and 9.4% of patients randomly assigned to placebo, ZEPBOUND 5 mg, 10 mg, and 15 mg, respectively. For Study 2 at Week 72, body weight was missing for 11.1%, 4.8%, and 8.4% of patients randomly assigned to placebo, ZEPBOUND 10 mg, and 15 mg, respectively. The missing values were imputed by a hybrid approach using retrieved dropouts from the same treatment group (if missing not due to COVID-19) or using all non-missing data assuming missing at random (for missing solely due to COVID-19).
b Least-squares mean from ANCOVA adjusted for baseline value and other stratification factors.
c Analyzed using logistic regression adjusted for baseline value.
d p-value<0.001 (unadjusted 2-sided) for superiority, controlled for type I error rate.
e Not controlled for type I error rate.
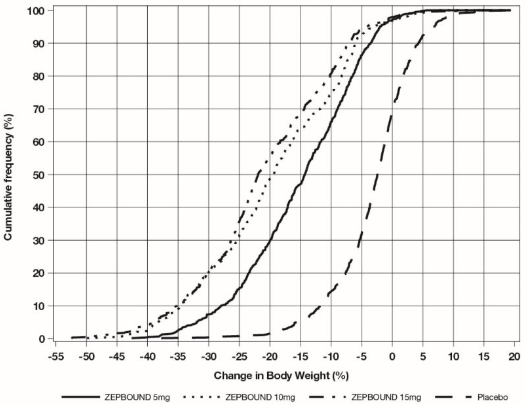
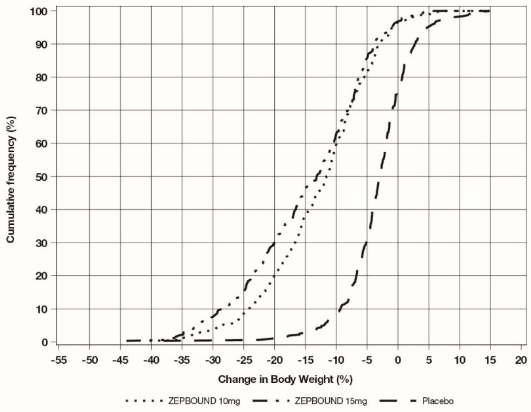
The cumulative frequency distributions of change in body weight are shown in Figure 1 for Study 1 and Figure 2 for Study 2. One way to interpret this figure is to select a change in body weight of interest on the horizontal axis and note the corresponding proportions of patients (vertical axis) in each treatment group who achieved at least that degree of weight reduction. For example, note that the vertical line arising from -10% in Figure 1 intersects the ZEPBOUND 15 mg and placebo curves at approximately 83.5%, and 18.8%, respectively, which correspond to the values shown in Table 3.
Figure 1: Changes in Body Weight (%) from Baseline to Week 72 in Study 1
Note: Based on average percent weight change of each randomized patient within each specific treatment arm from 100 imputed datasets including observed data and imputed data using hybrid approach for missing values.
Figure 2: Changes in Body Weight (%) from Baseline to Week 72 in Study 2
Note: Based on average percent weight change of each randomized patient within each specific treatment arm from 100 imputed datasets including observed data and imputed data using hybrid approach for missing values.
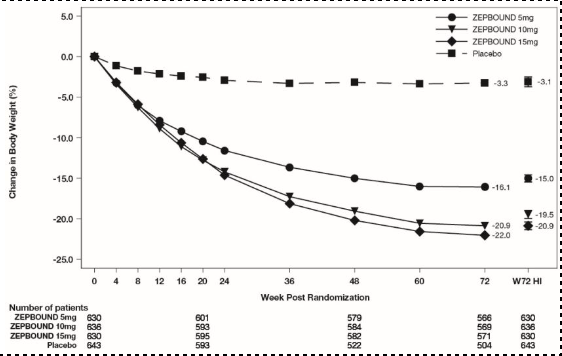
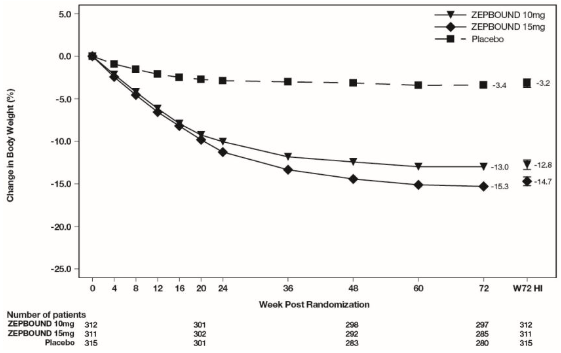
The time courses of weight reduction with ZEPBOUND and placebo from baseline through Week 72 are depicted in Figure 3 for Study 1 and Figure 4 for Study 2.
Figure 3: Change from Baseline (%) in Body Weight in Study 1
Note: Displayed results are from the Intent-to-Treat Population. (1) Observed mean value from Week 0 to Week 72, and (2) least-squares mean ± standard error at Week 72 hybrid imputation (HI).
Figure 4: Change from Baseline (%) in Body Weight in Study 2
Note: Displayed results are from the Intent-to-Treat Population. (1) Observed mean value from Week 0 to Week 72, and (2) least squares mean ± standard error at Week 72 hybrid imputation (HI).
Effect of ZEPBOUND on Anthropometry and Cardiometabolic Parameters
Changes in waist circumference and cardiometabolic parameters with ZEPBOUND are shown in Table 4 for Study 1 and Study 2.
Table 4. Changes in Anthropometry and Cardiometabolic Parameters at Week 72 in Studies 1 and 2:
| Study 1 | Study 2 | ||||||
| Intention-to-Treat (ITT) Population a | Placebo N = 643 | ZEPBOUND 5 mg N = 630 | ZEPBOUND 10 mg N = 636 | ZEPBOUND 15 mg N = 630 | Placebo N = 315 | ZEPBOUND 10 mg N = 312 | ZEPBOUND 15 mg N = 311 |
| Waist Circumference (cm) | |||||||
| Baseline mean | 114.0 | 113.2 | 114.8 | 114.4 | 116.0 | 114.2 | 114.6 |
| Change from baseline b | -4.0 | -14.0 | -17.7 | -18.5 | -3.3 | -10.8 | -13.1 |
| Difference from placebo b (95% CI) | -10.1 (-11.6, -8.6) e | -13.8 (-15.2, -12.3) d | -14.5 (-15.9, -13.0) d | -7.4 (-9.0, -5.9) d | -9.8 (-11.2, -8.3) d | ||
| Systolic Blood Pressure (mmHg) | |||||||
| Baseline mean | 122.9 | 123.6 | 123.8 | 123.0 | 131.0 | 130.6 | 130.0 |
| Change from baseline b | -1.0 | -6.6 | -7.7 | -7.4 | -1.2 | -5.6 | -7.1 |
| Difference from placebo b (95% CI) | -5.6 (-7.2, -3.9) e | -6.7 (-8.4, -5.0) e | -6.4 (-8.0, -4.8) e | -4.4 (-6.7, -2.1) e | -5.9 (-8.3, -3.6) e | ||
| Diastolic Blood Pressure (mmHg) | |||||||
| Baseline mean | 79.6 | 79.3 | 79.9 | 79.3 | 79.4 | 80.2 | 79.7 |
| Change from baseline b | -0.8 | -4.9 | -5.0 | -4.5 | -0.3 | -2.1 | -2.9 |
| Difference from placebo b (95% CI) | -4.1 (-5.2, -3.0) e | -4.2 (-5.3, -3.0) e | -3.7 (-4.8, -2.7) e | -1.8 (-3.3, -0.4) e | -2.7 (-4.2, -1.2) e | ||
| Pulse Rate (beats per minute) | |||||||
| Baseline mean | 72.9 | 72.4 | 71.8 | 72.4 | 74.8 | 75.9 | 75.6 |
| Change from baseline f | 0.1 | 0.6 | 2.3 | 2.6 | -0.5 | 0.6 | 1.0 |
| Difference from placebo f (95% CI) | 0.5 (-0.5, 1.5) e | 2.2 (1.2, 3.2) e | 2.5 (1.5, 3.4) e | 1.2 (-0.1, 2.5) e | 1.5 (0.2, 2.8) e | ||
| Total Cholesterol (mg/dL) | |||||||
| Baseline mean g | 187.5 | 187.1 | 190.6 | 187.5 | 174.9 | 173.9 | 167.0 |
| % change from baseline b | -1.8 | -3.8 | -4.4 | -6.3 | 2.8 | -2.8 | -1.0 |
| Relative difference from placebo b (95% CI) | -2.1 (-4.5, 0.4) c,e | -2.7 (-5.1, -0.2) c,e | -4.6 (-6.8, -2.2) c,e | -5.5 (-8.7, -2.2) c,e | -3.8 (-7.1, -0.3) c,e | ||
| LDL Cholesterol (mg/dL) | |||||||
| Baseline mean g | 109.4 | 108.7 | 112.3 | 109.3 | 92.4 | 90.5 | 85.7 |
| % change from baseline b | -1.7 | -4.6 | -5.6 | -7.1 | 7.4 | 1.8 | 4.1 |
| Relative difference from placebo b (95% CI) | -2.9 (-6.6, 0.9) c,e | -4.0 (-7.5, -0.5) c,e | -5.5 (-8.9, -2.0) c,e | -5.2 (-10.1, 0.1) c,e | -3.0 (-8.4, 2.6) c,e | ||
| HDL (mg/dL) | |||||||
| Baseline mean g | 46.6 | 47.6 | 47.6 | 47.6 | 42.7 | 43.8 | 42.2 |
| % change from baseline b | -0.7 | 6.9 | 9.2 | 8.0 | 0.2 | 8.2 | 9.7 |
| Relative difference from placebo b (95% CI) | 7.7 (4.6, 10.8) c,e | 9.9 (6.7, 13.2) c,e | 8.7 (5.7, 11.8) c,e | 8.0 (4.2, 11.8) c,e | 9.5 (5.6, 13.5) c,e | ||
| Non-HDL (mg/dL) | |||||||
| Baseline mean g | 138.3 | 137.0 | 140.4 | 137.5 | 129.6 | 127.2 | 121.9 |
| % change from baseline b | -2.3 | -8.0 | -9.4 | -11.7 | 3.7 | -6.6 | -5.2 |
| Relative difference from placebo b (95% CI) | -5.8 (-8.9, -2.6) c,e | -7.2 (-10.3, -4.1) c,e | -9.6 (-12.4, -6.6) c,e | -9.9 (-14.1, -5.6) c,e | -8.5 (-12.9, -4.0) c,e | ||
| Triglycerides (mg/dL) | |||||||
| Baseline mean g | 130.8 | 128.7 | 125.7 | 128.1 | 165.0 | 158.8 | 158.5 |
| % change from baseline b | -5.6 | -21.2 | -23.8 | -29.1 | -3.3 | -27.1 | -27.3 |
| Relative difference from placebo b (95% CI) | -16.5 (-21.2, -11.4) c,e | -19.3 (-23.9, -14.4) c,e | -24.9 (-29.1, -20.4) c,e | -24.6 (-30.0, -18.7) c,e | -24.8 (-30.3, -18.9) c,e | ||
| HbA1c (%) | |||||||
| Baseline mean | 5.6 | 5.6 | 5.5 | 5.6 | 8.0 | 8.0 | 8.1 |
| Change from baseline b | -0.1 | -0.4 | -0.4 | -0.4 | -0.5 | -2.1 | -2.1 |
| Difference from placebo b (95% CI) | -0.3 (-0.3, -0.2) e | -0.4 (-0.4, -0.3) e | -0.4 (-0.4, -0.3) e | -1.6 (-1.7, -1.4) d | -1.6 (-1.8, -1.4) d | ||
Abbreviations: ANCOVA = analysis of covariance; CI = confidence interval; N = number of patients randomly assigned to study drug.
a The intention-to-treat population includes all randomly assigned patients. The missing values were imputed by a hybrid approach using retrieved dropouts from the same treatment group (if missing not due to COVID-19) or using all non-missing data assuming missing at random (for missing solely due to COVID-19).
b Least-squares mean from ANCOVA adjusted for baseline value and other stratification factors.
c Analyzed using log-transformed data.
d p-value<0.001 (unadjusted 2-sided) for superiority, controlled for type I error rate.
e Not controlled for type I error rate.
f Least-squares mean from mixed model for repeated measures adjusted for baseline value and other stratification factors.
g Baseline value is the geometric mean.
© All content on this website, including data entry, data processing, decision support tools, "RxReasoner" logo and graphics, is the intellectual property of RxReasoner and is protected by copyright laws. Unauthorized reproduction or distribution of any part of this content without explicit written permission from RxReasoner is strictly prohibited. Any third-party content used on this site is acknowledged and utilized under fair use principles.


